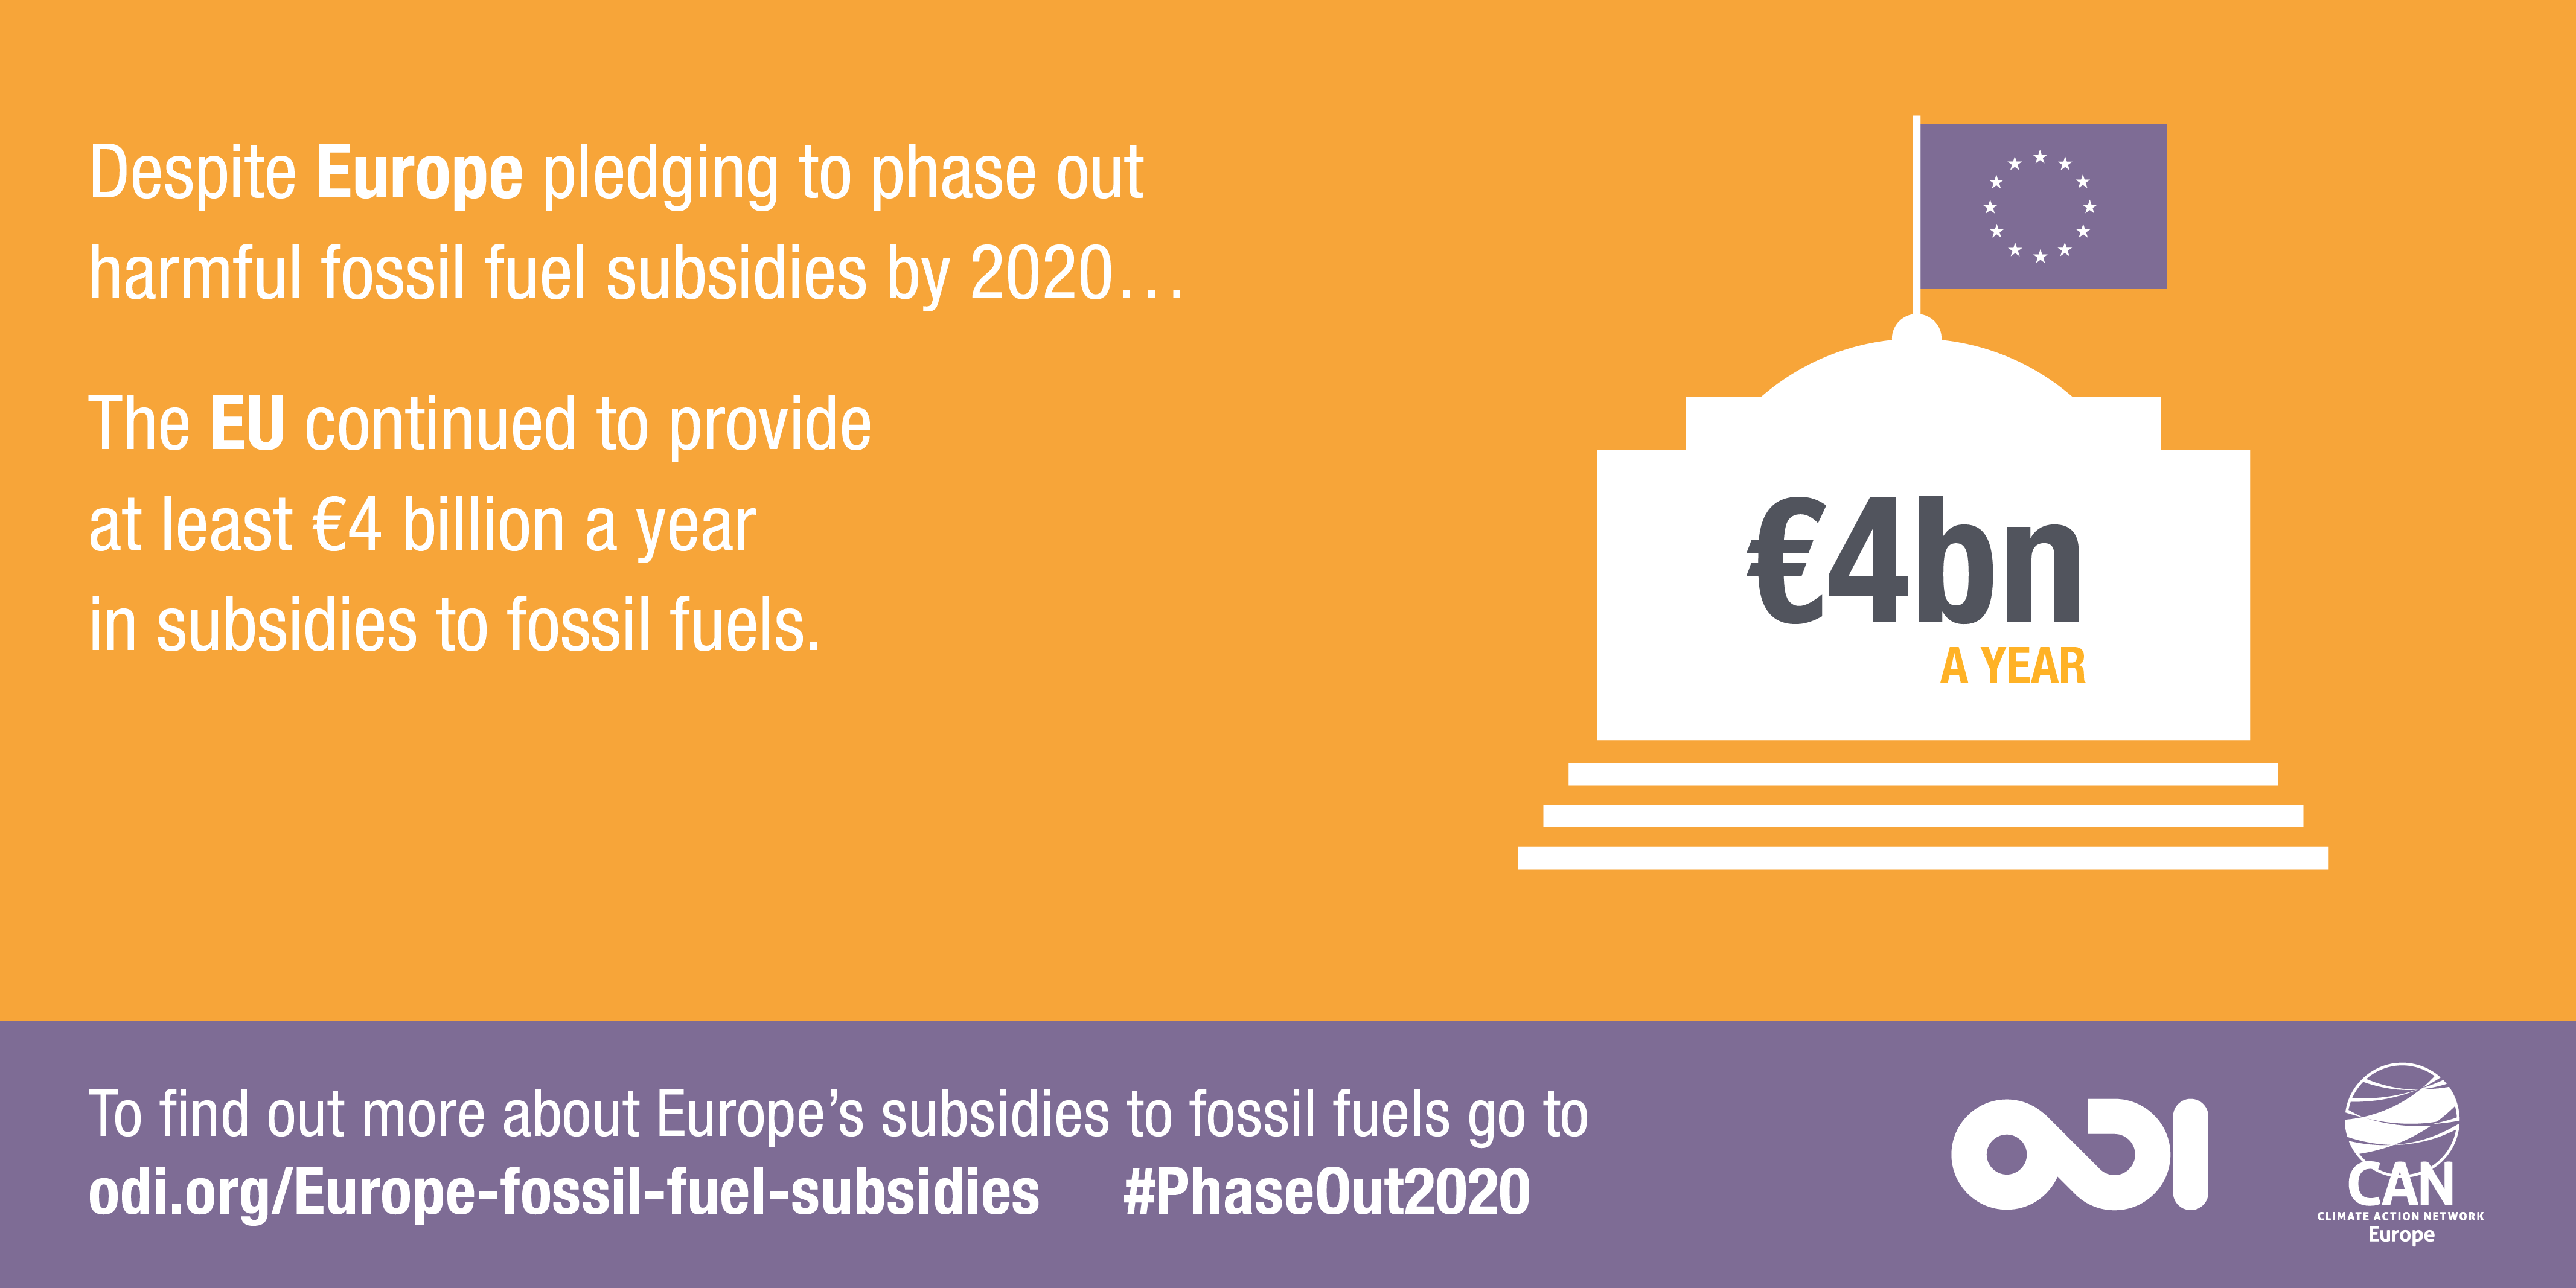
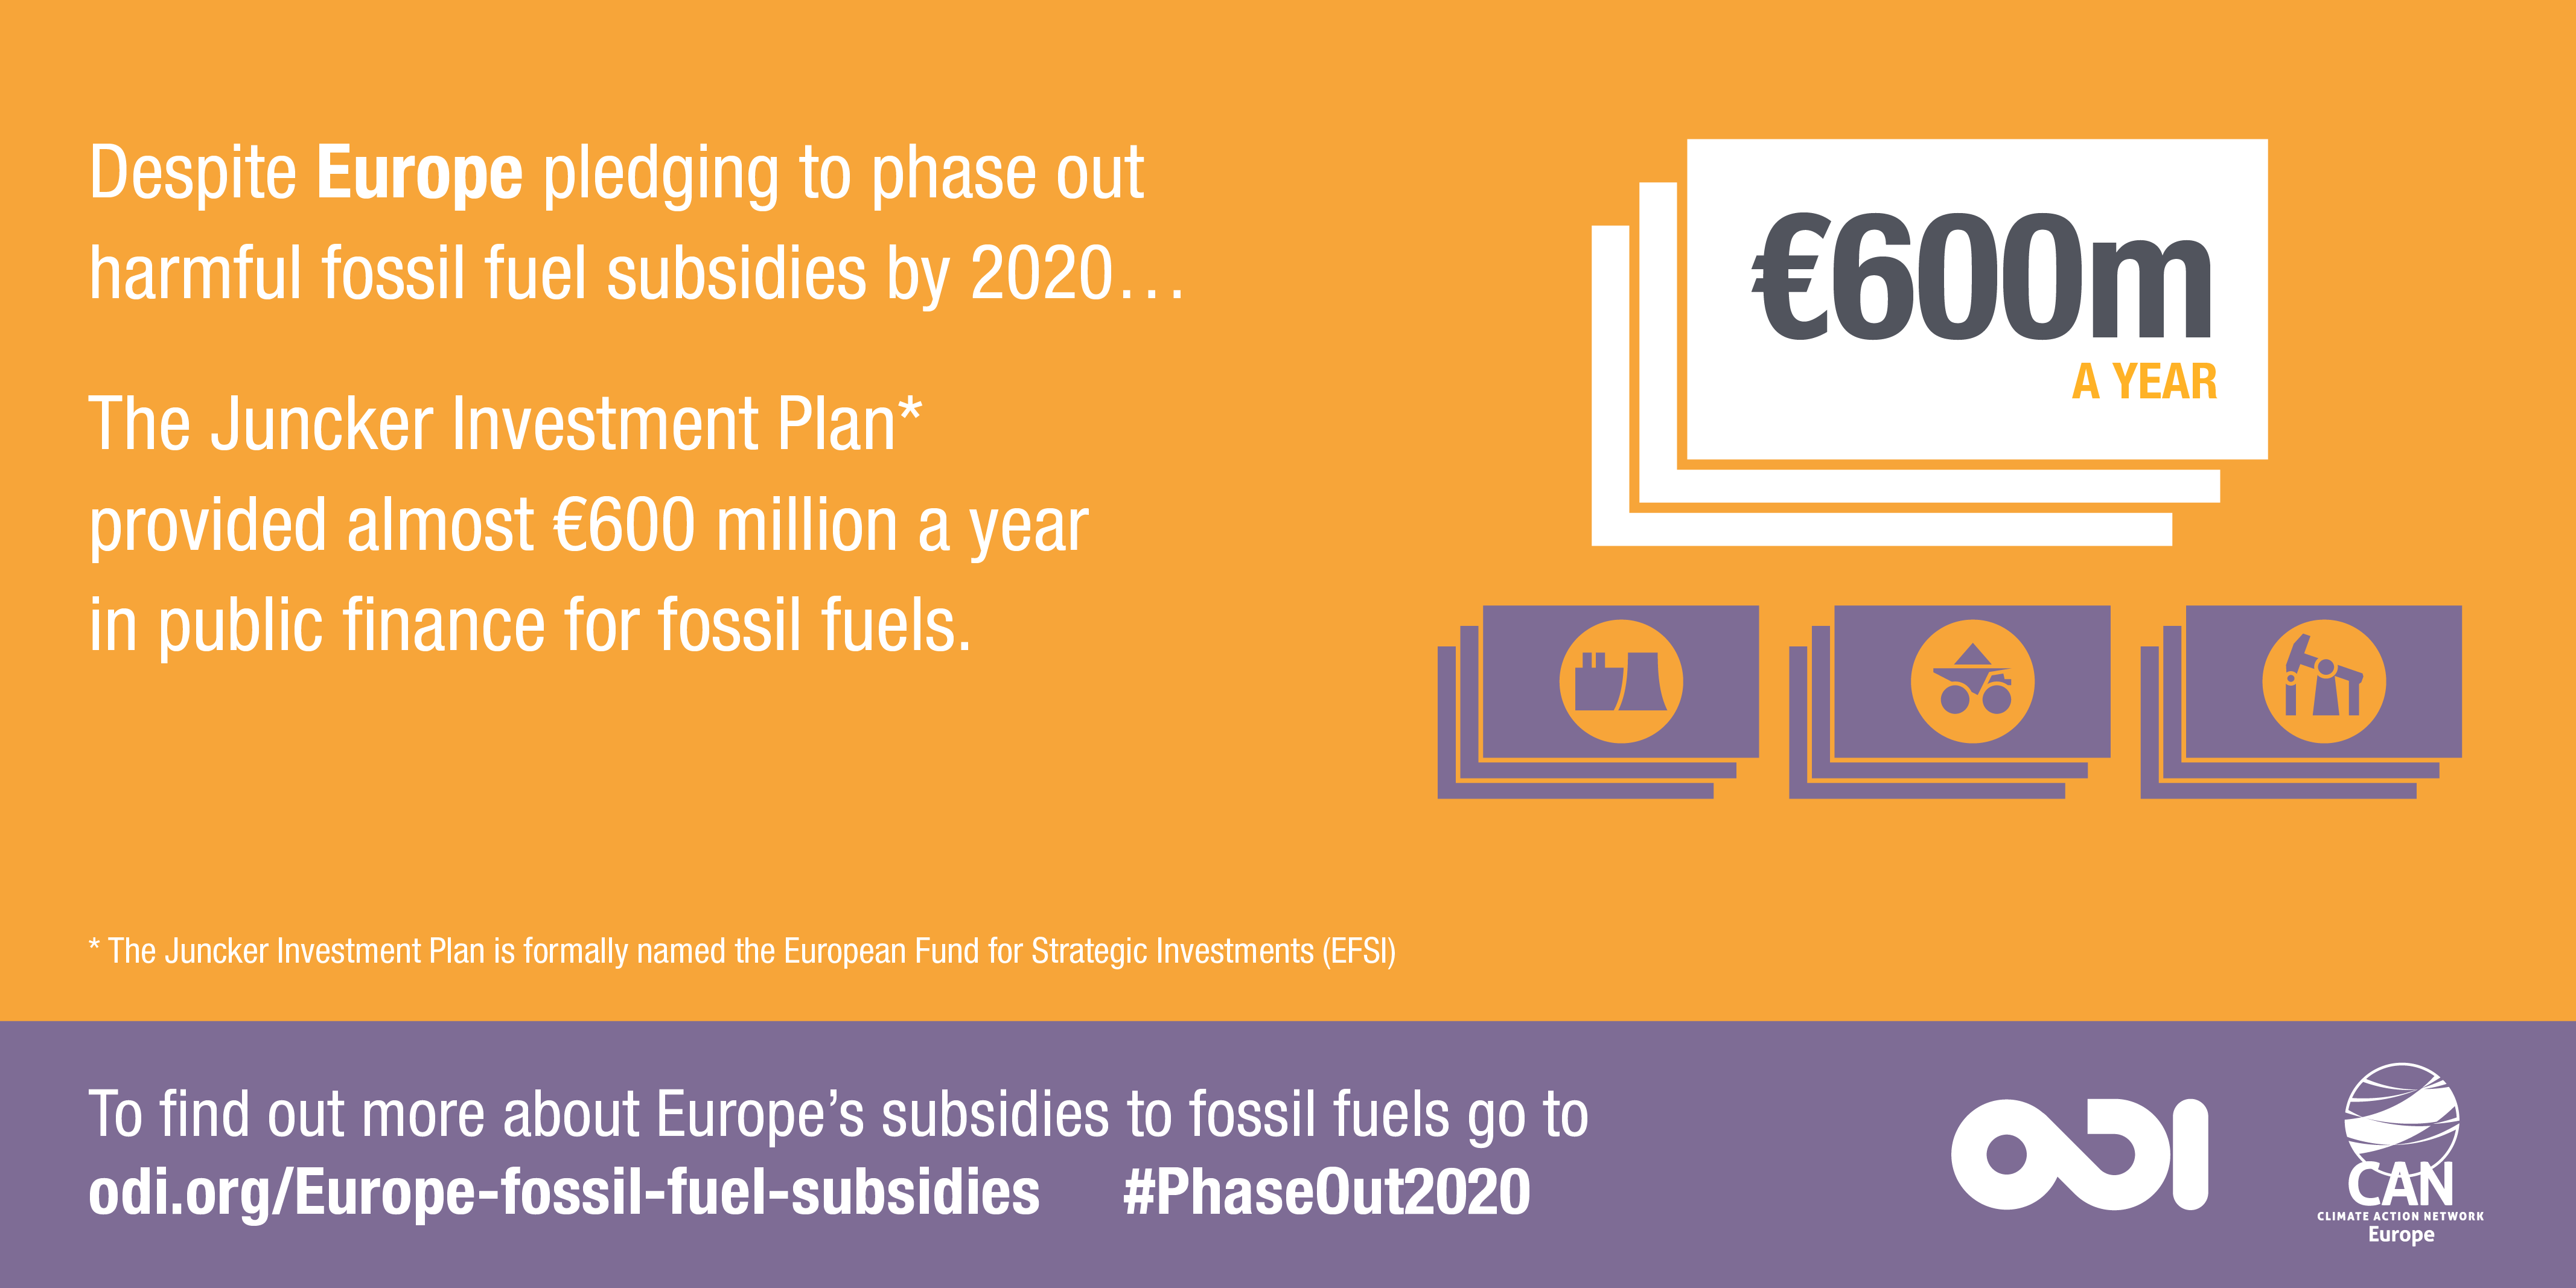
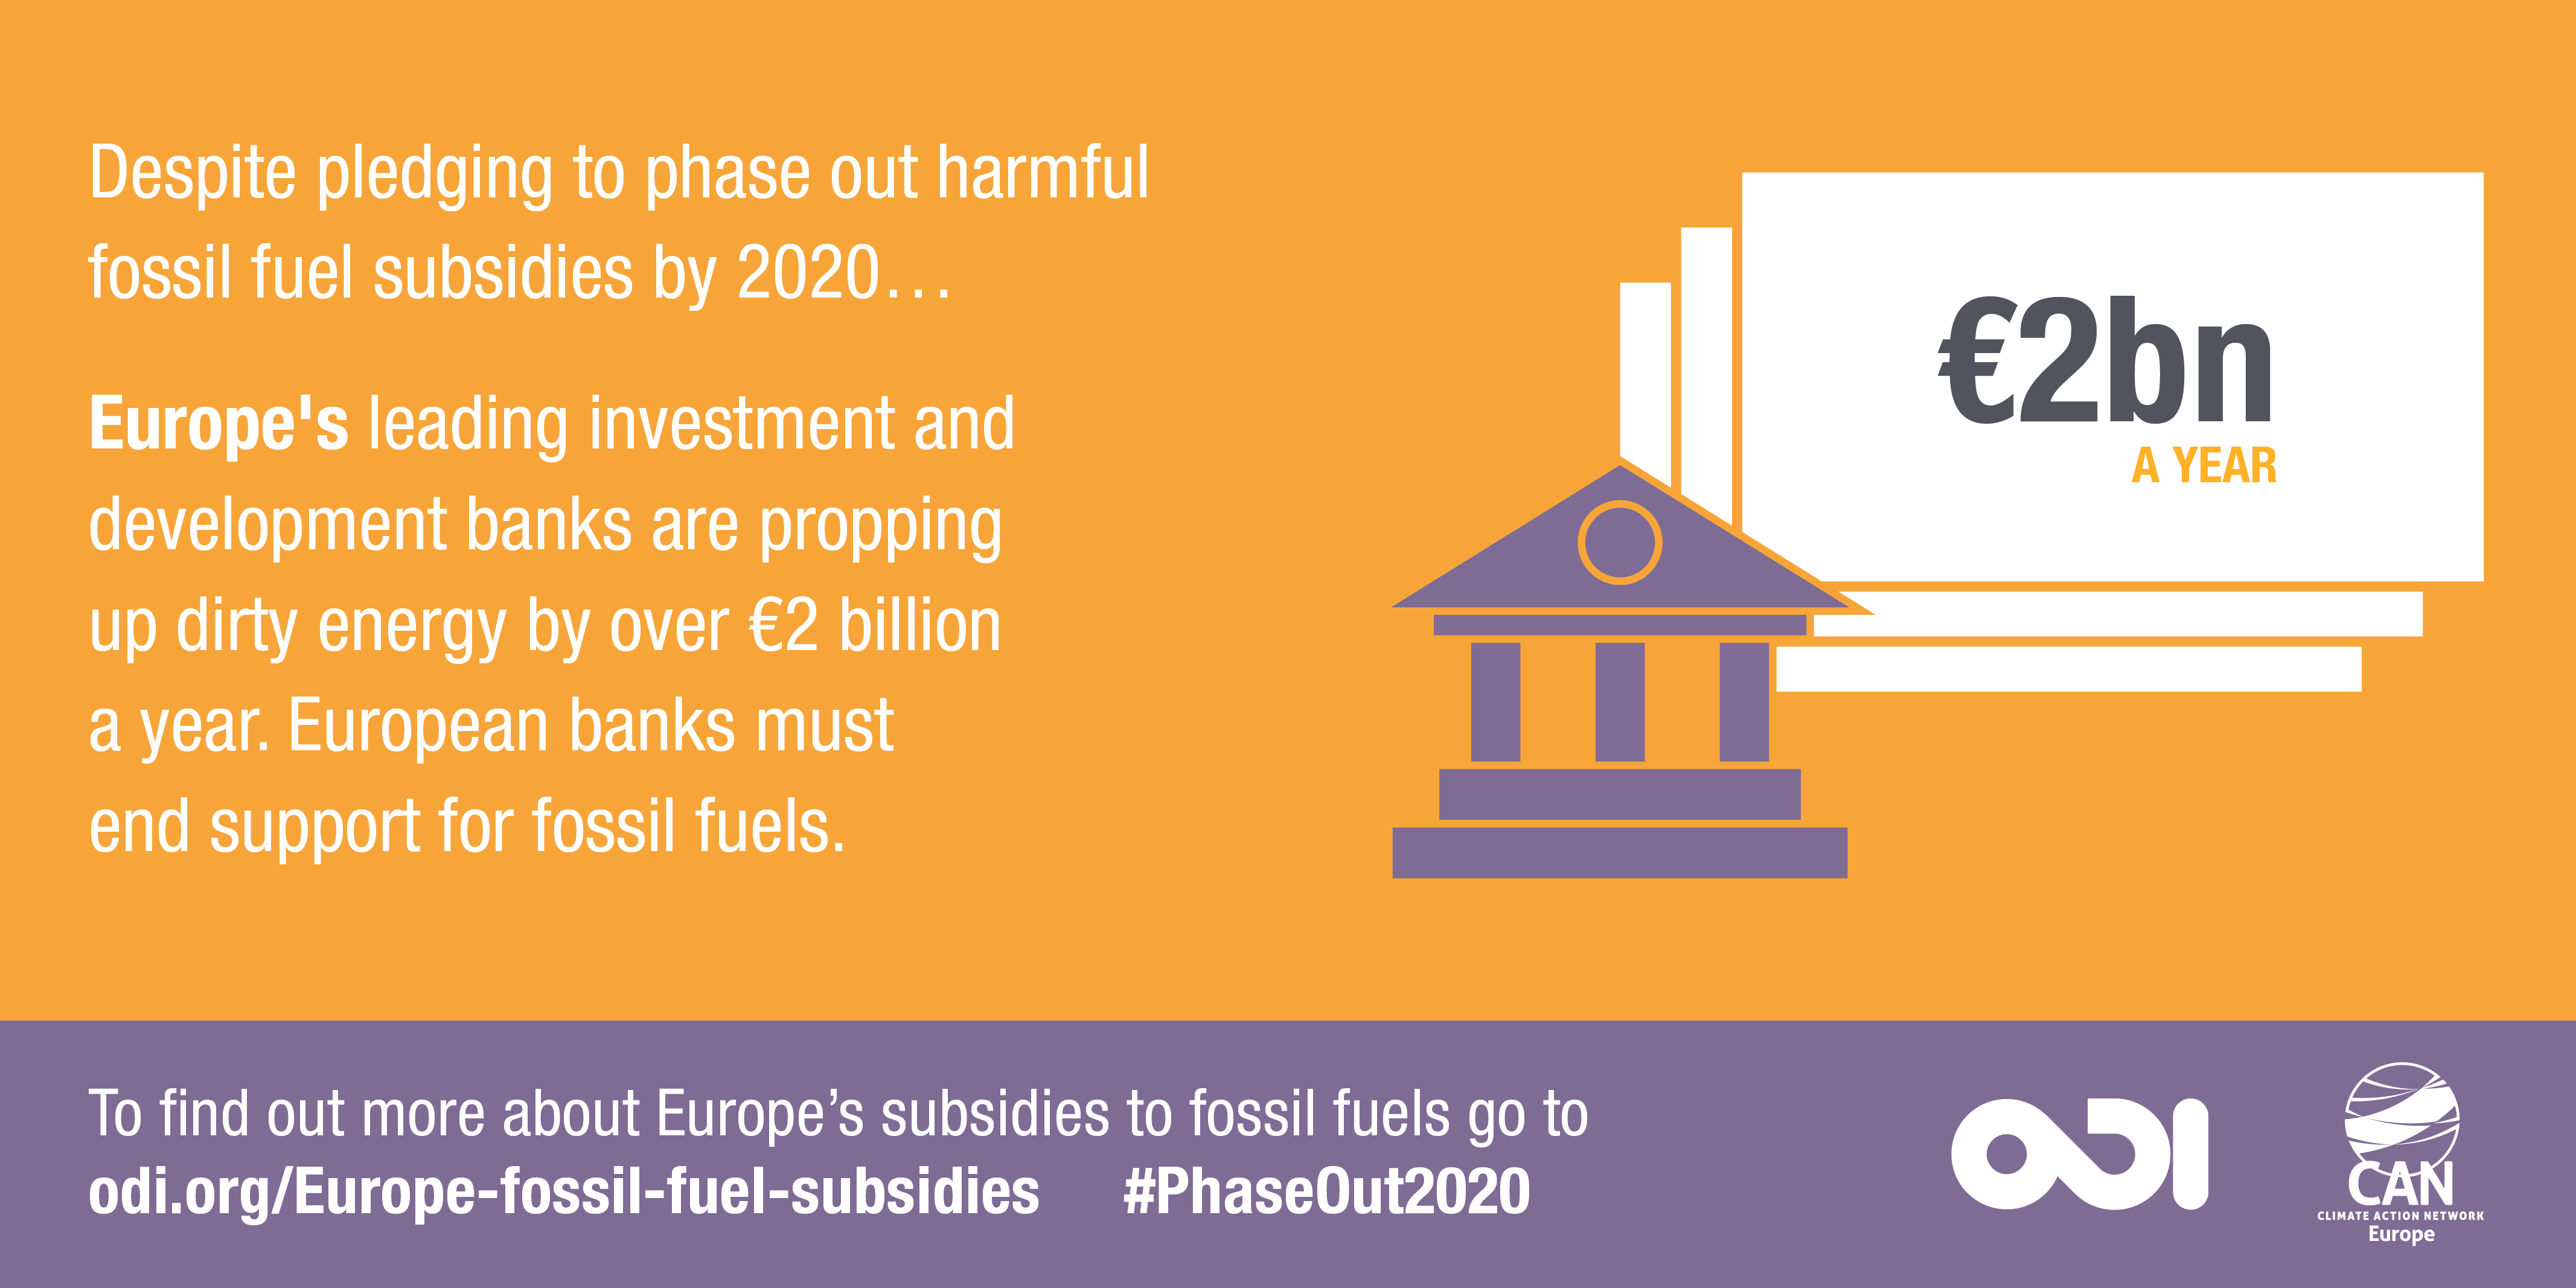
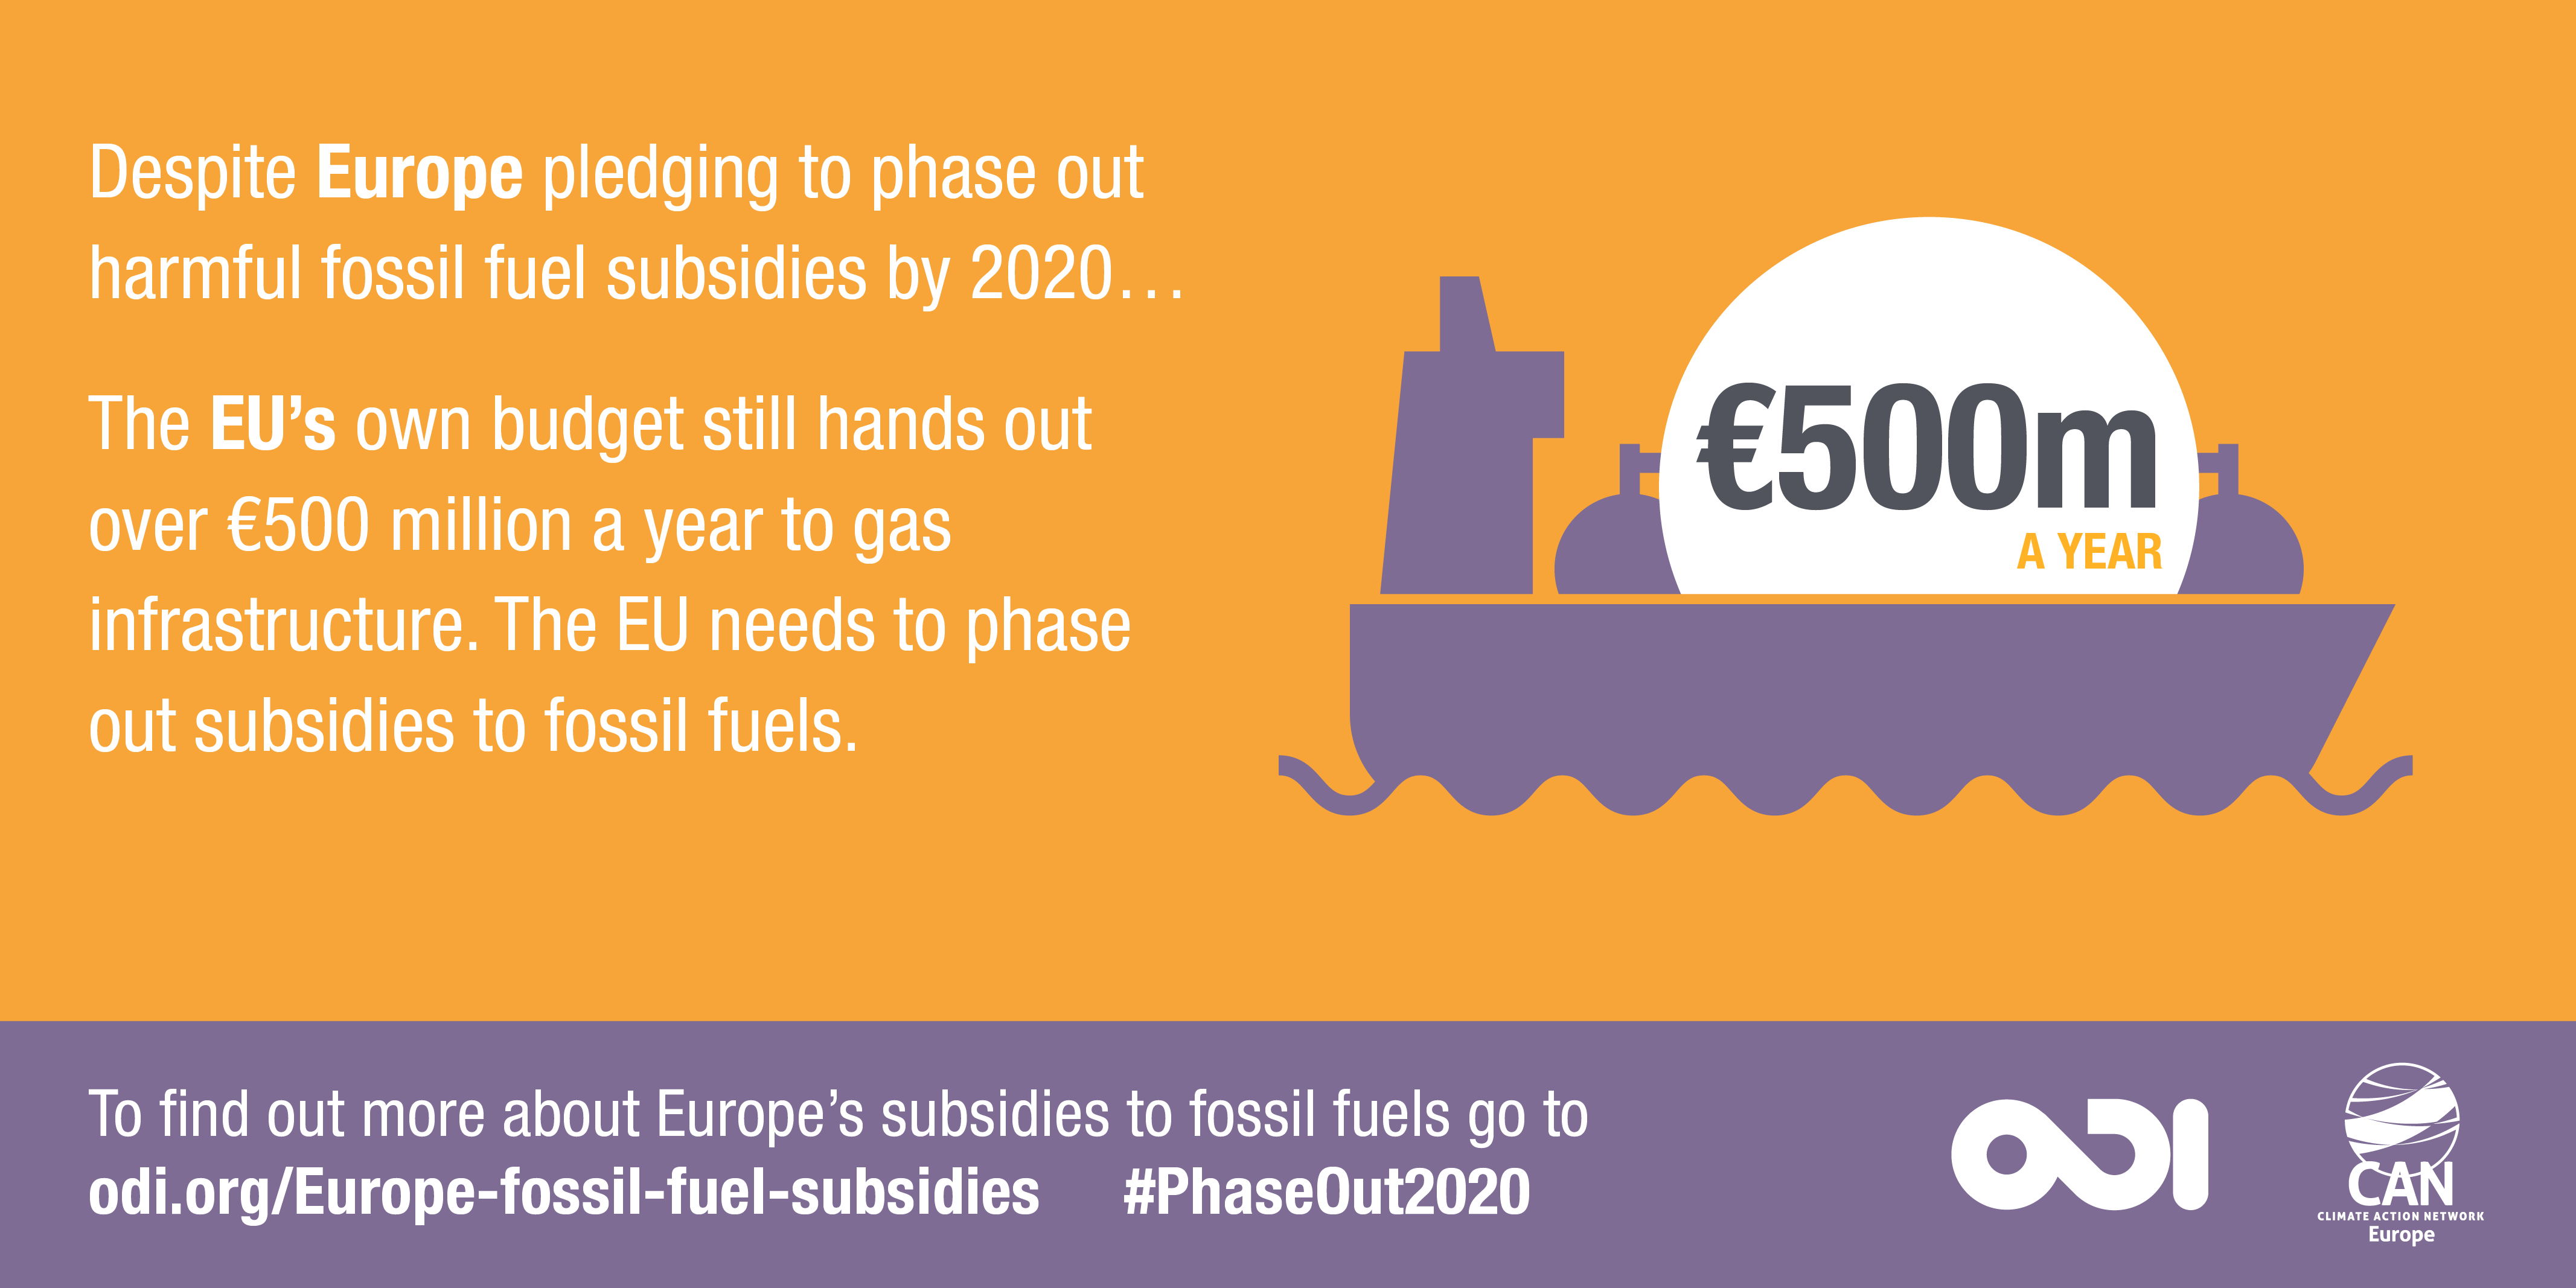
On this page you can find visual material produced by CAN Europe on the topic of fossil fuel subsidies phase out and shifting financial flows.
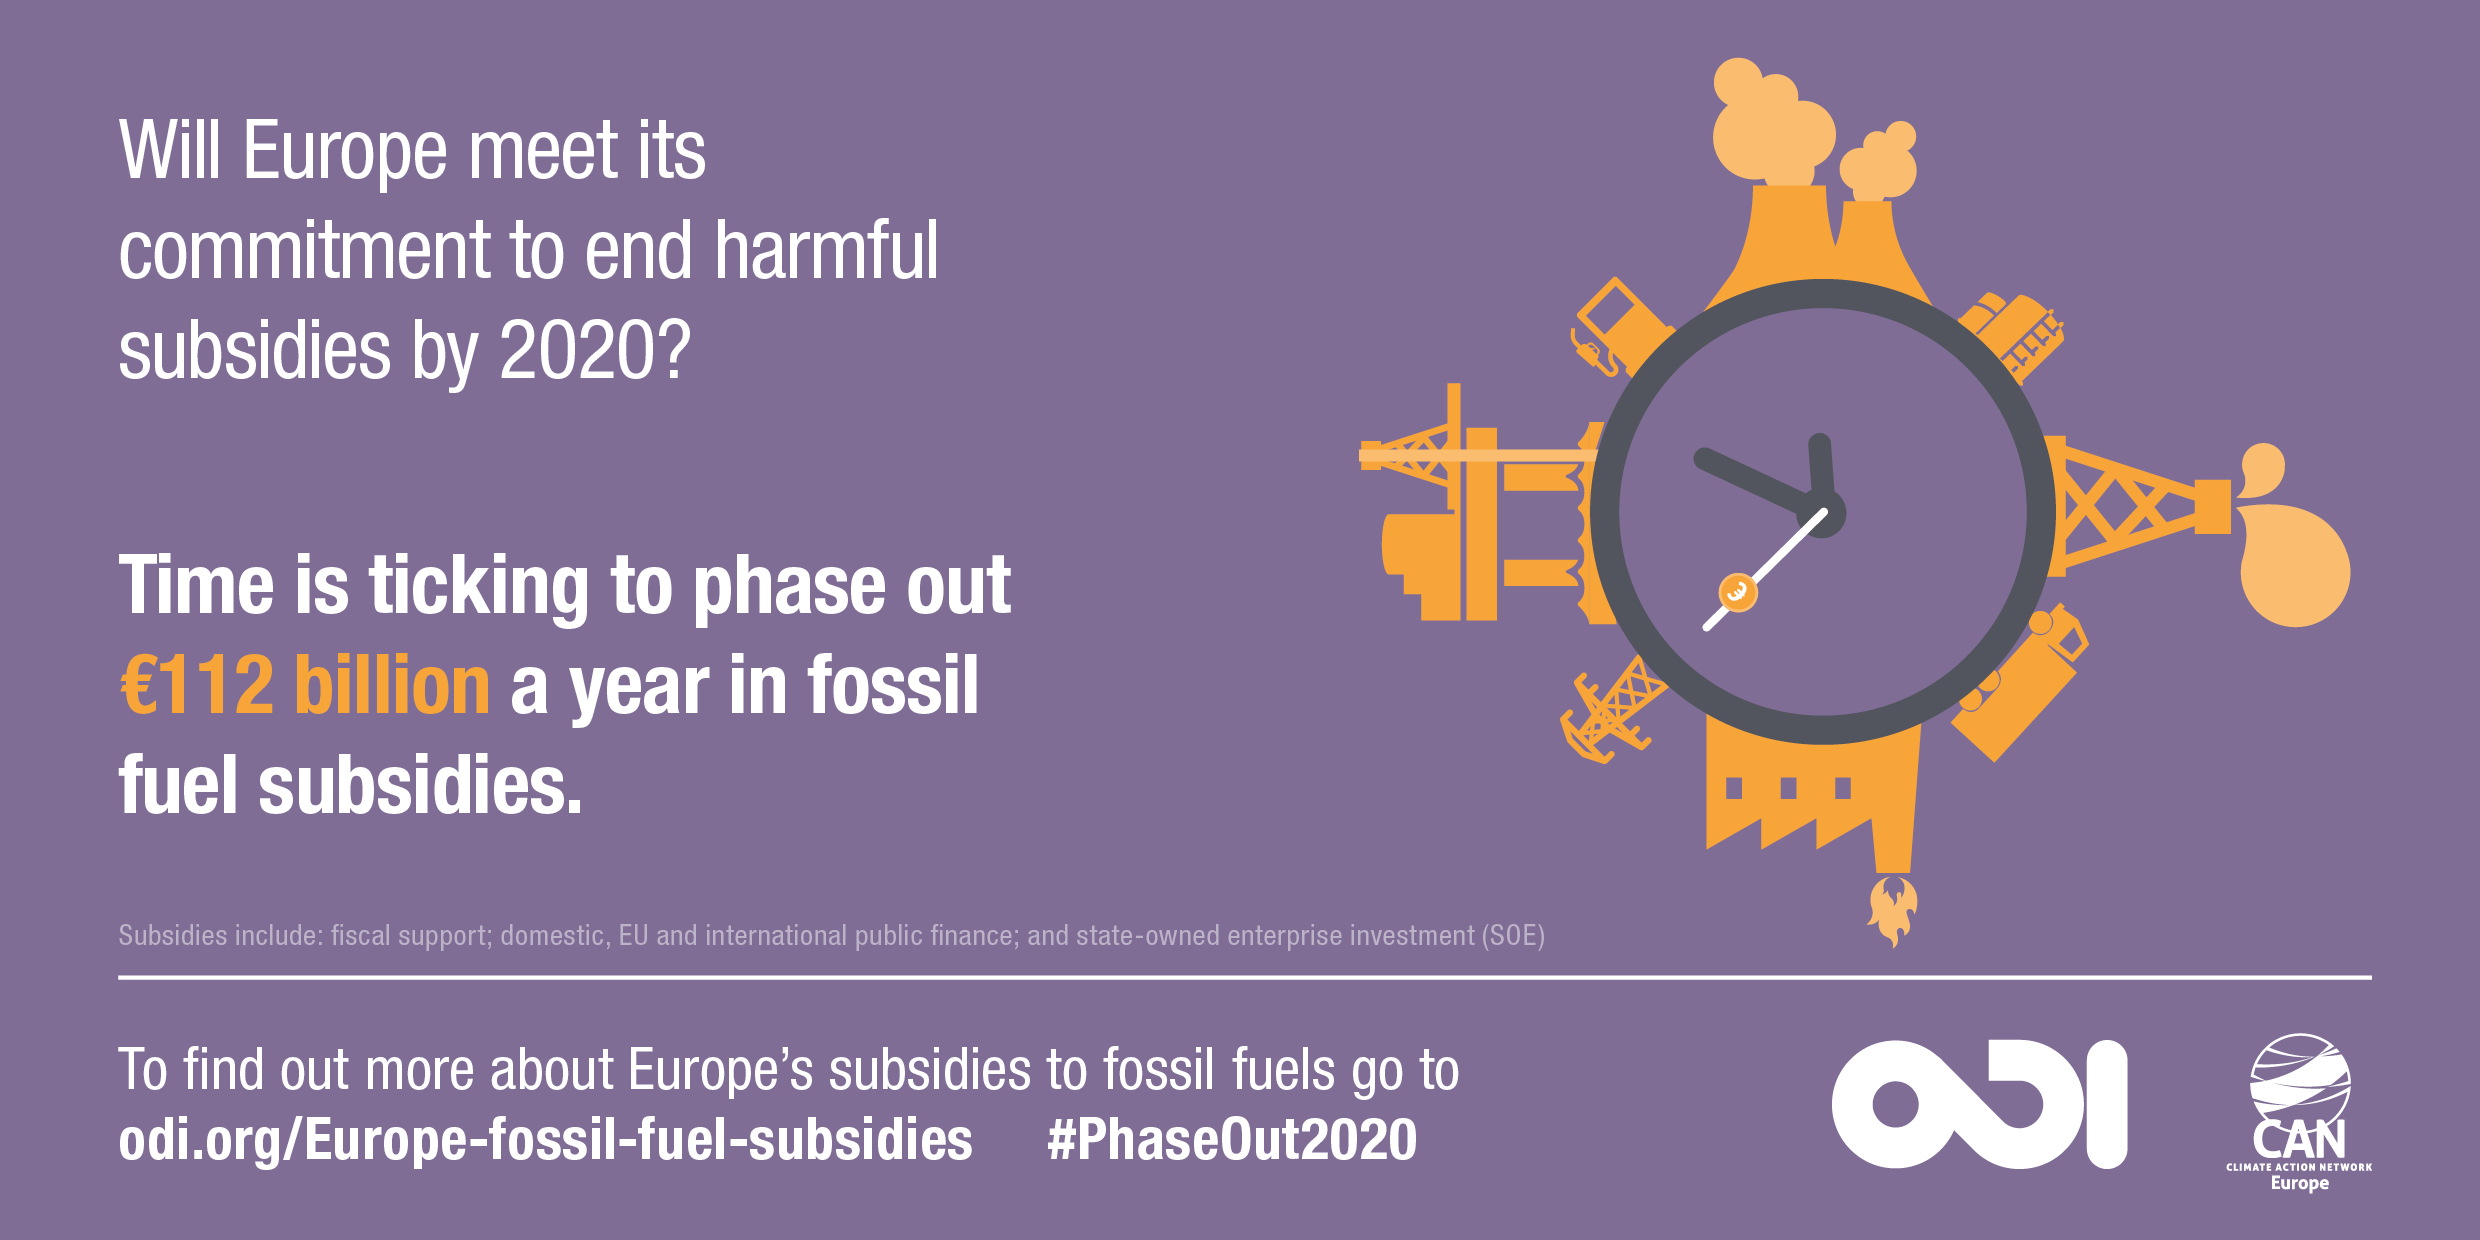
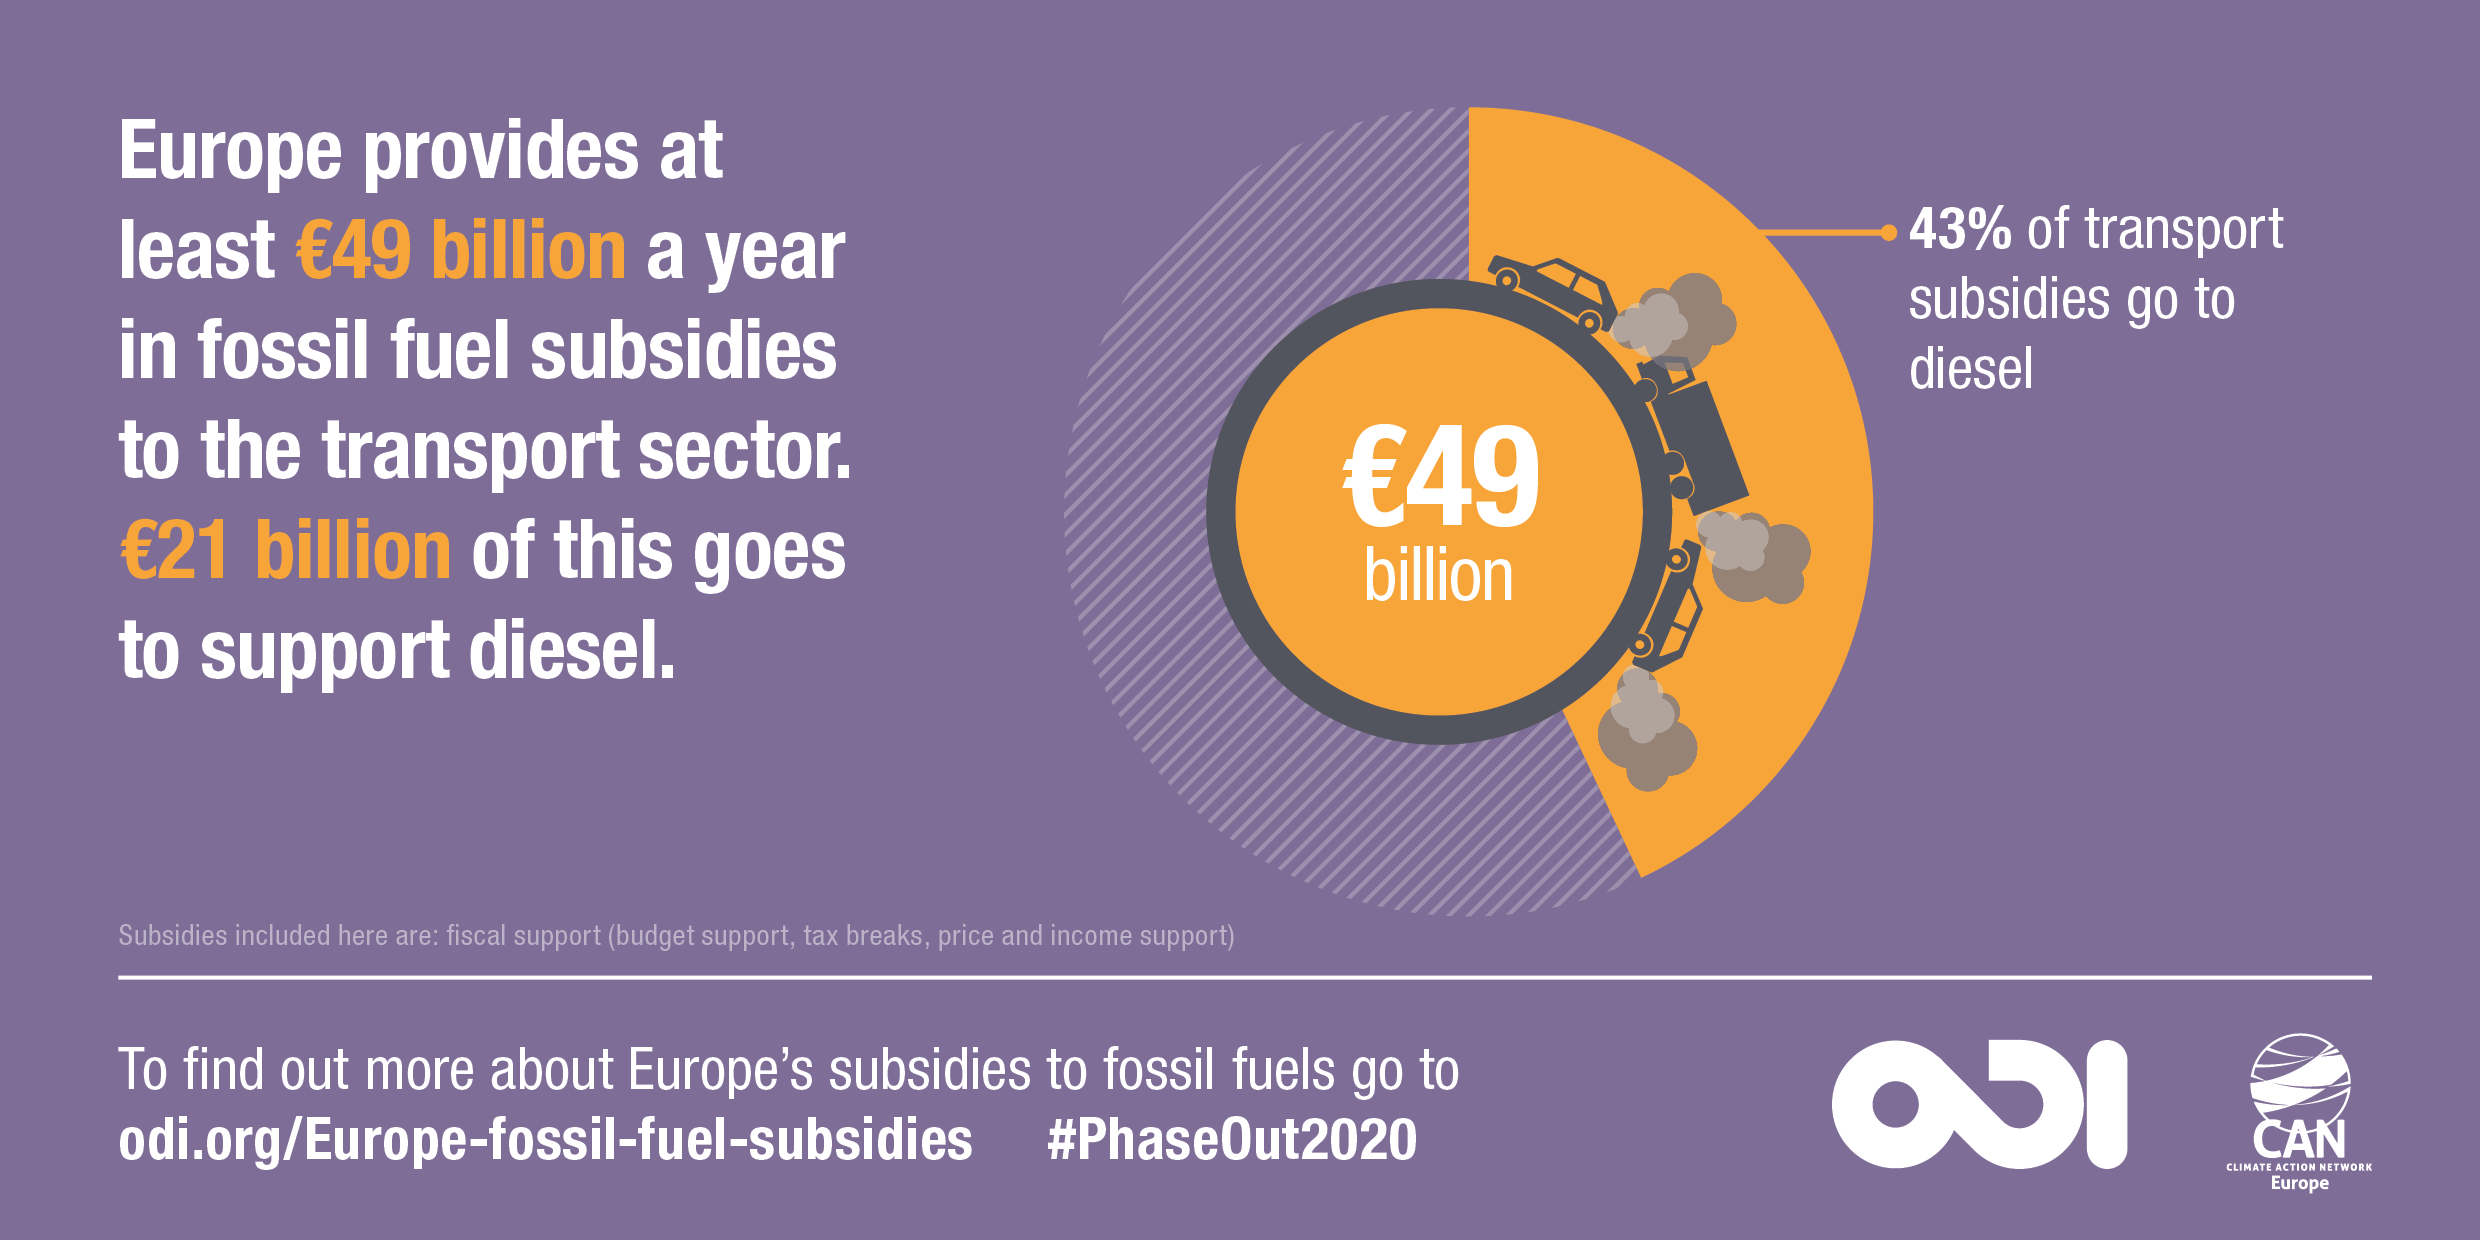
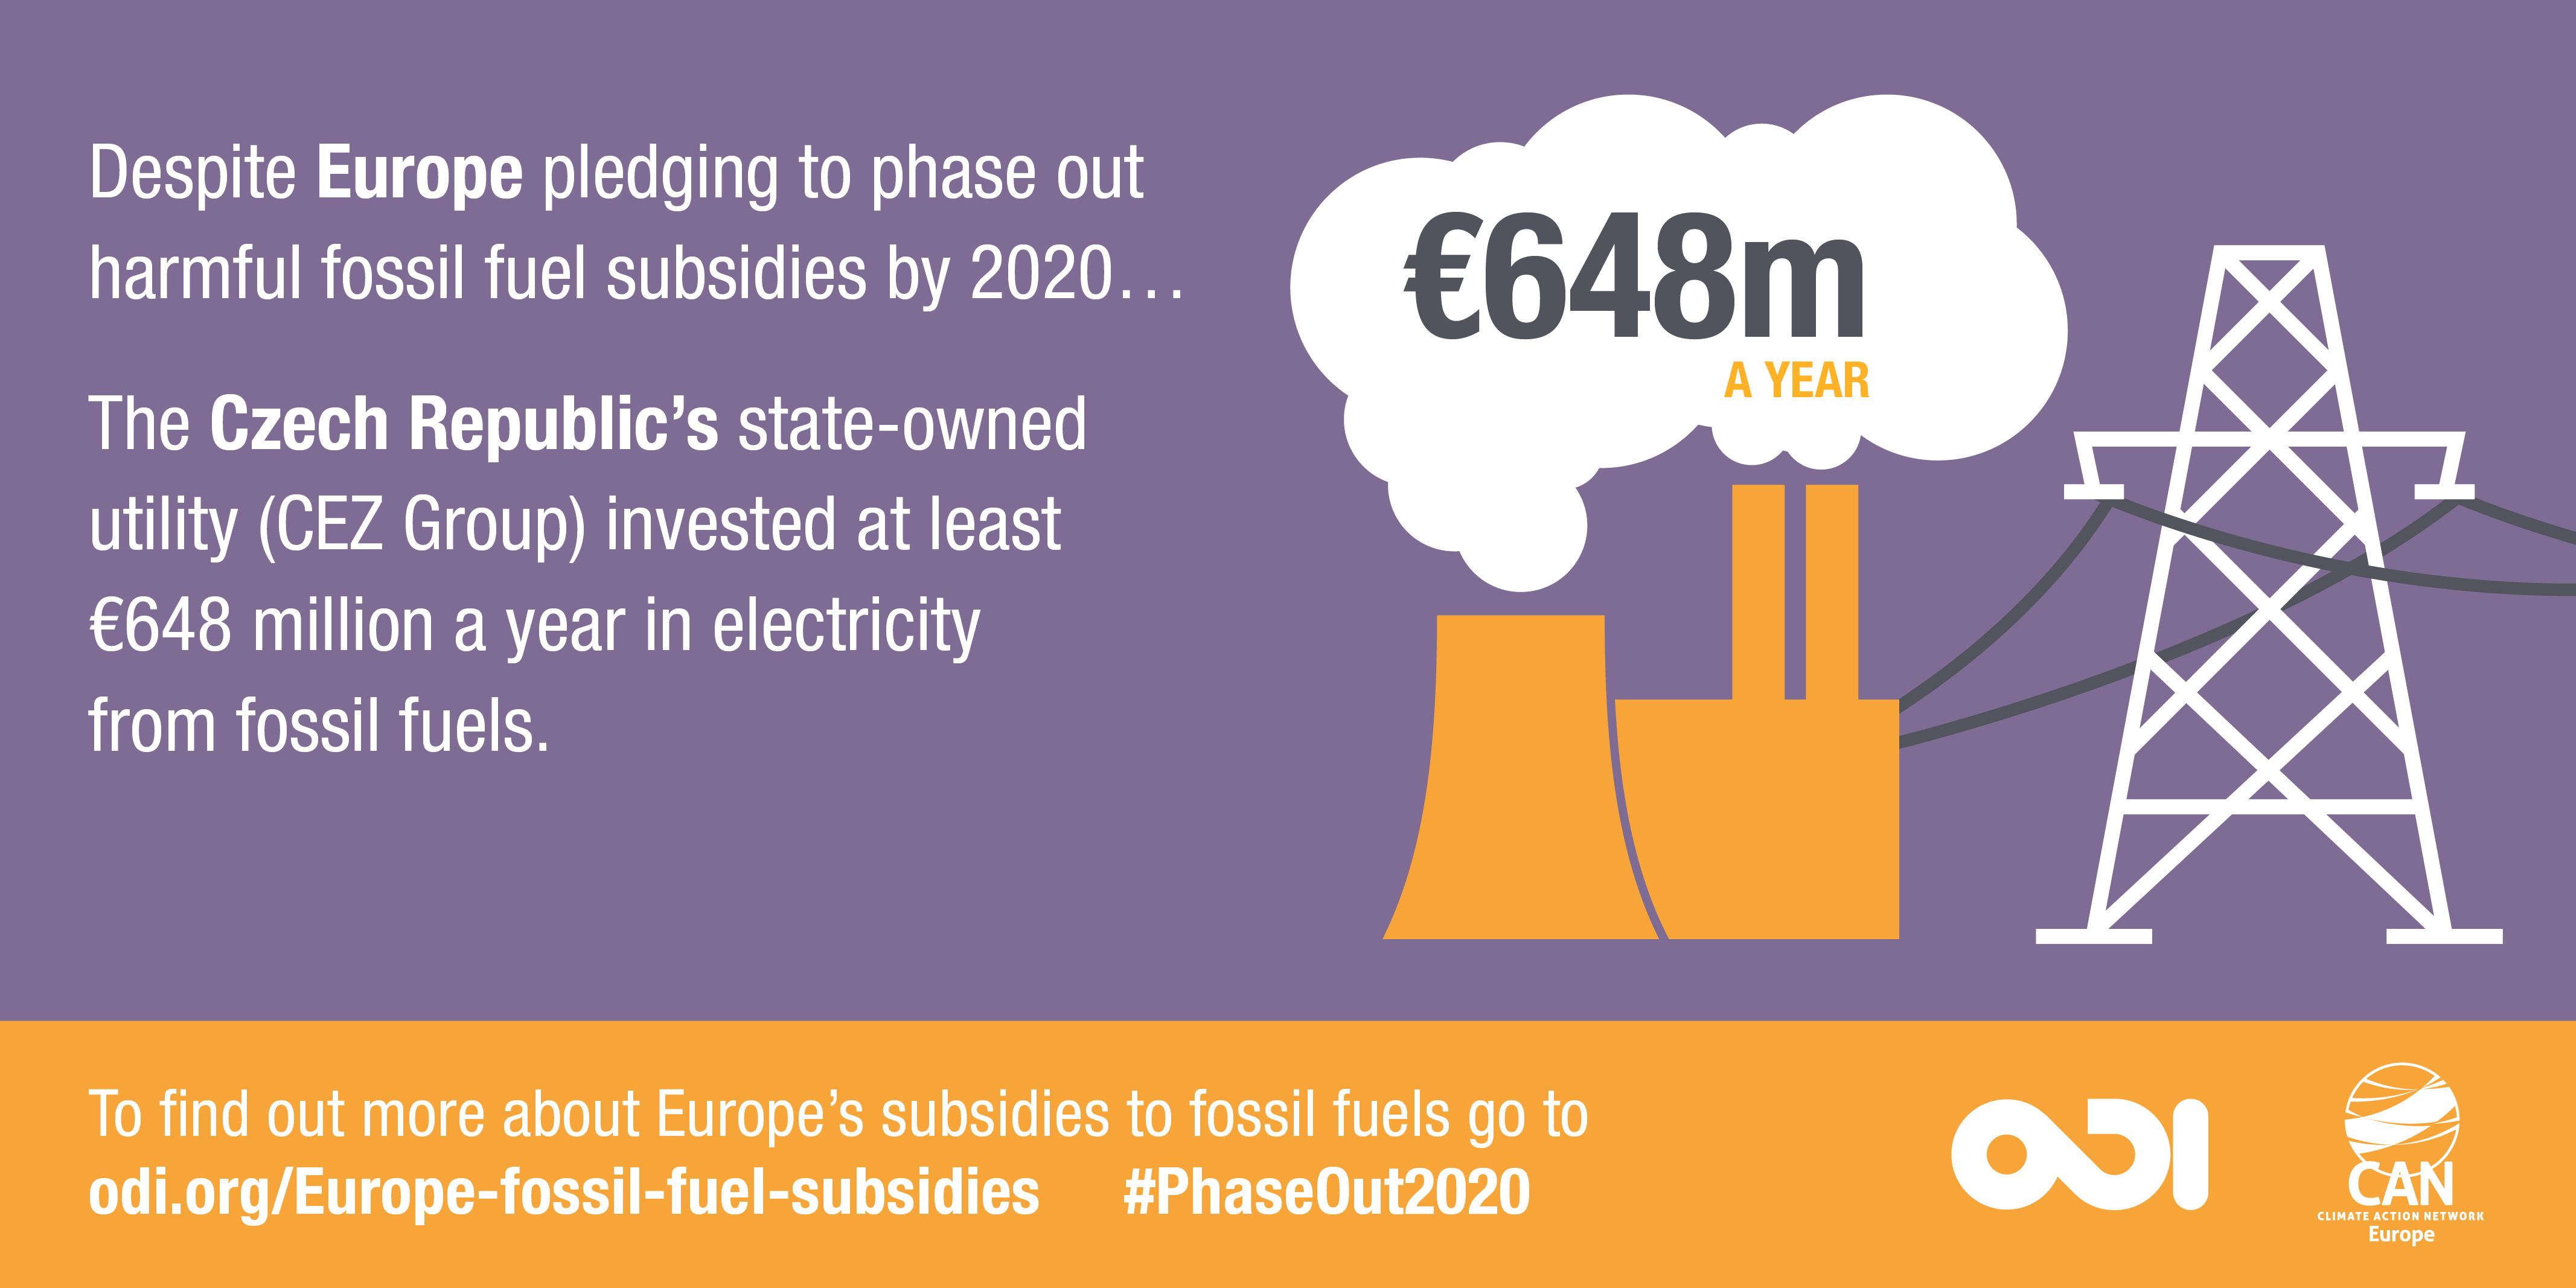
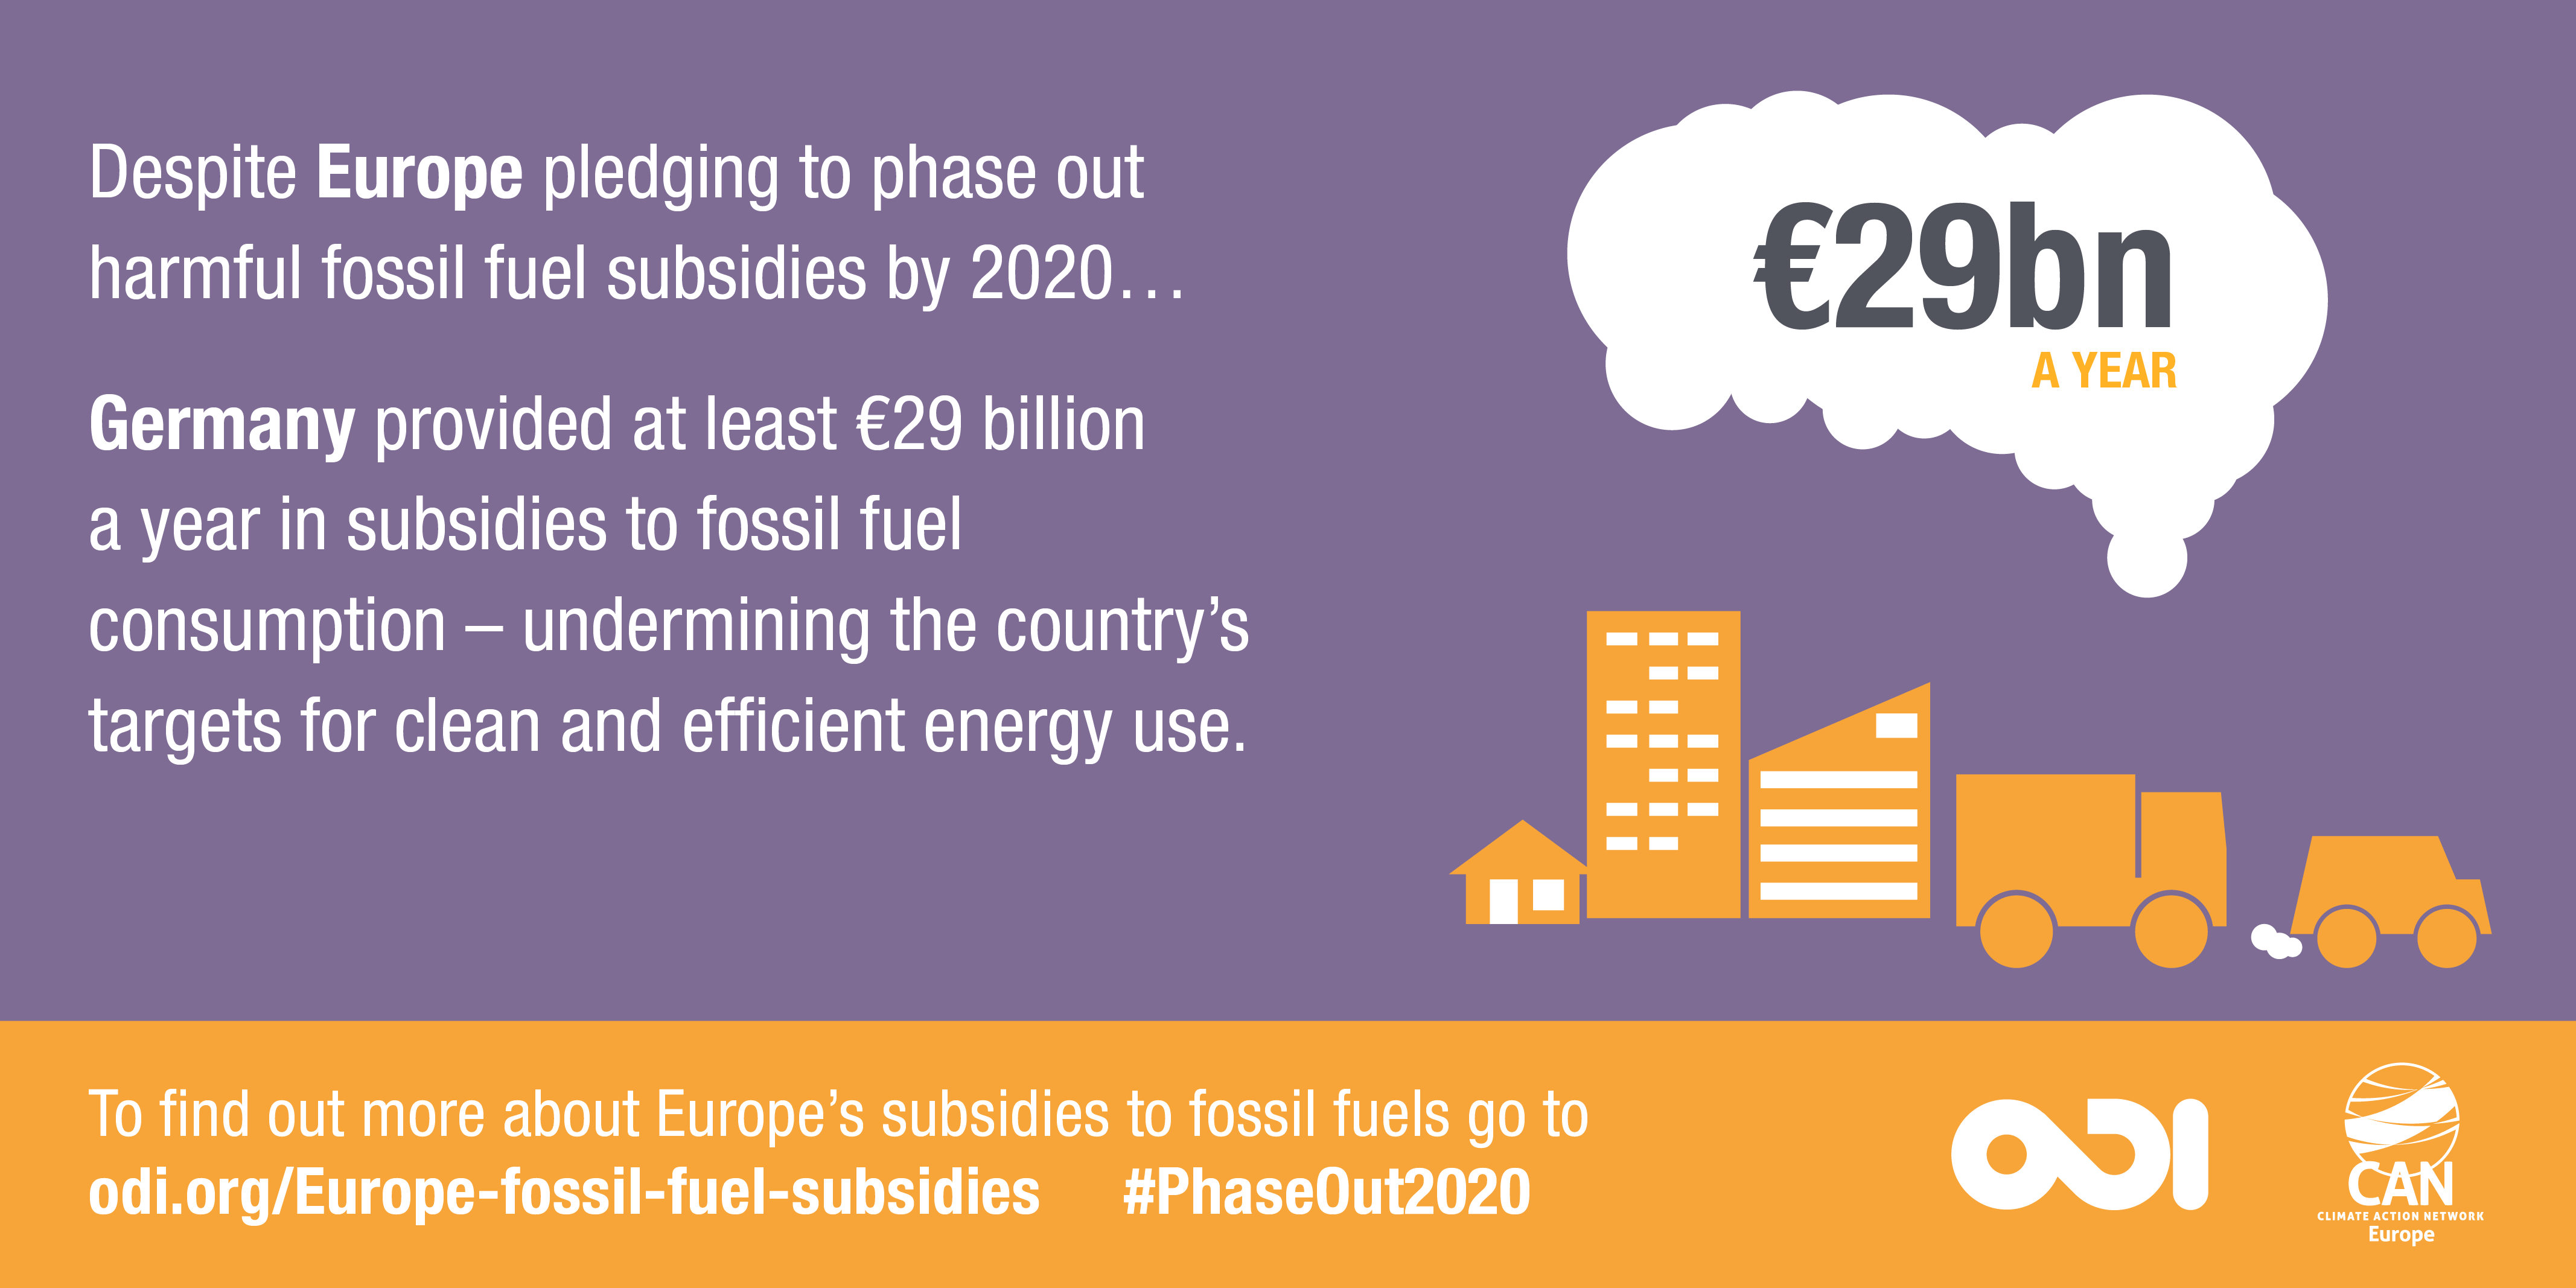
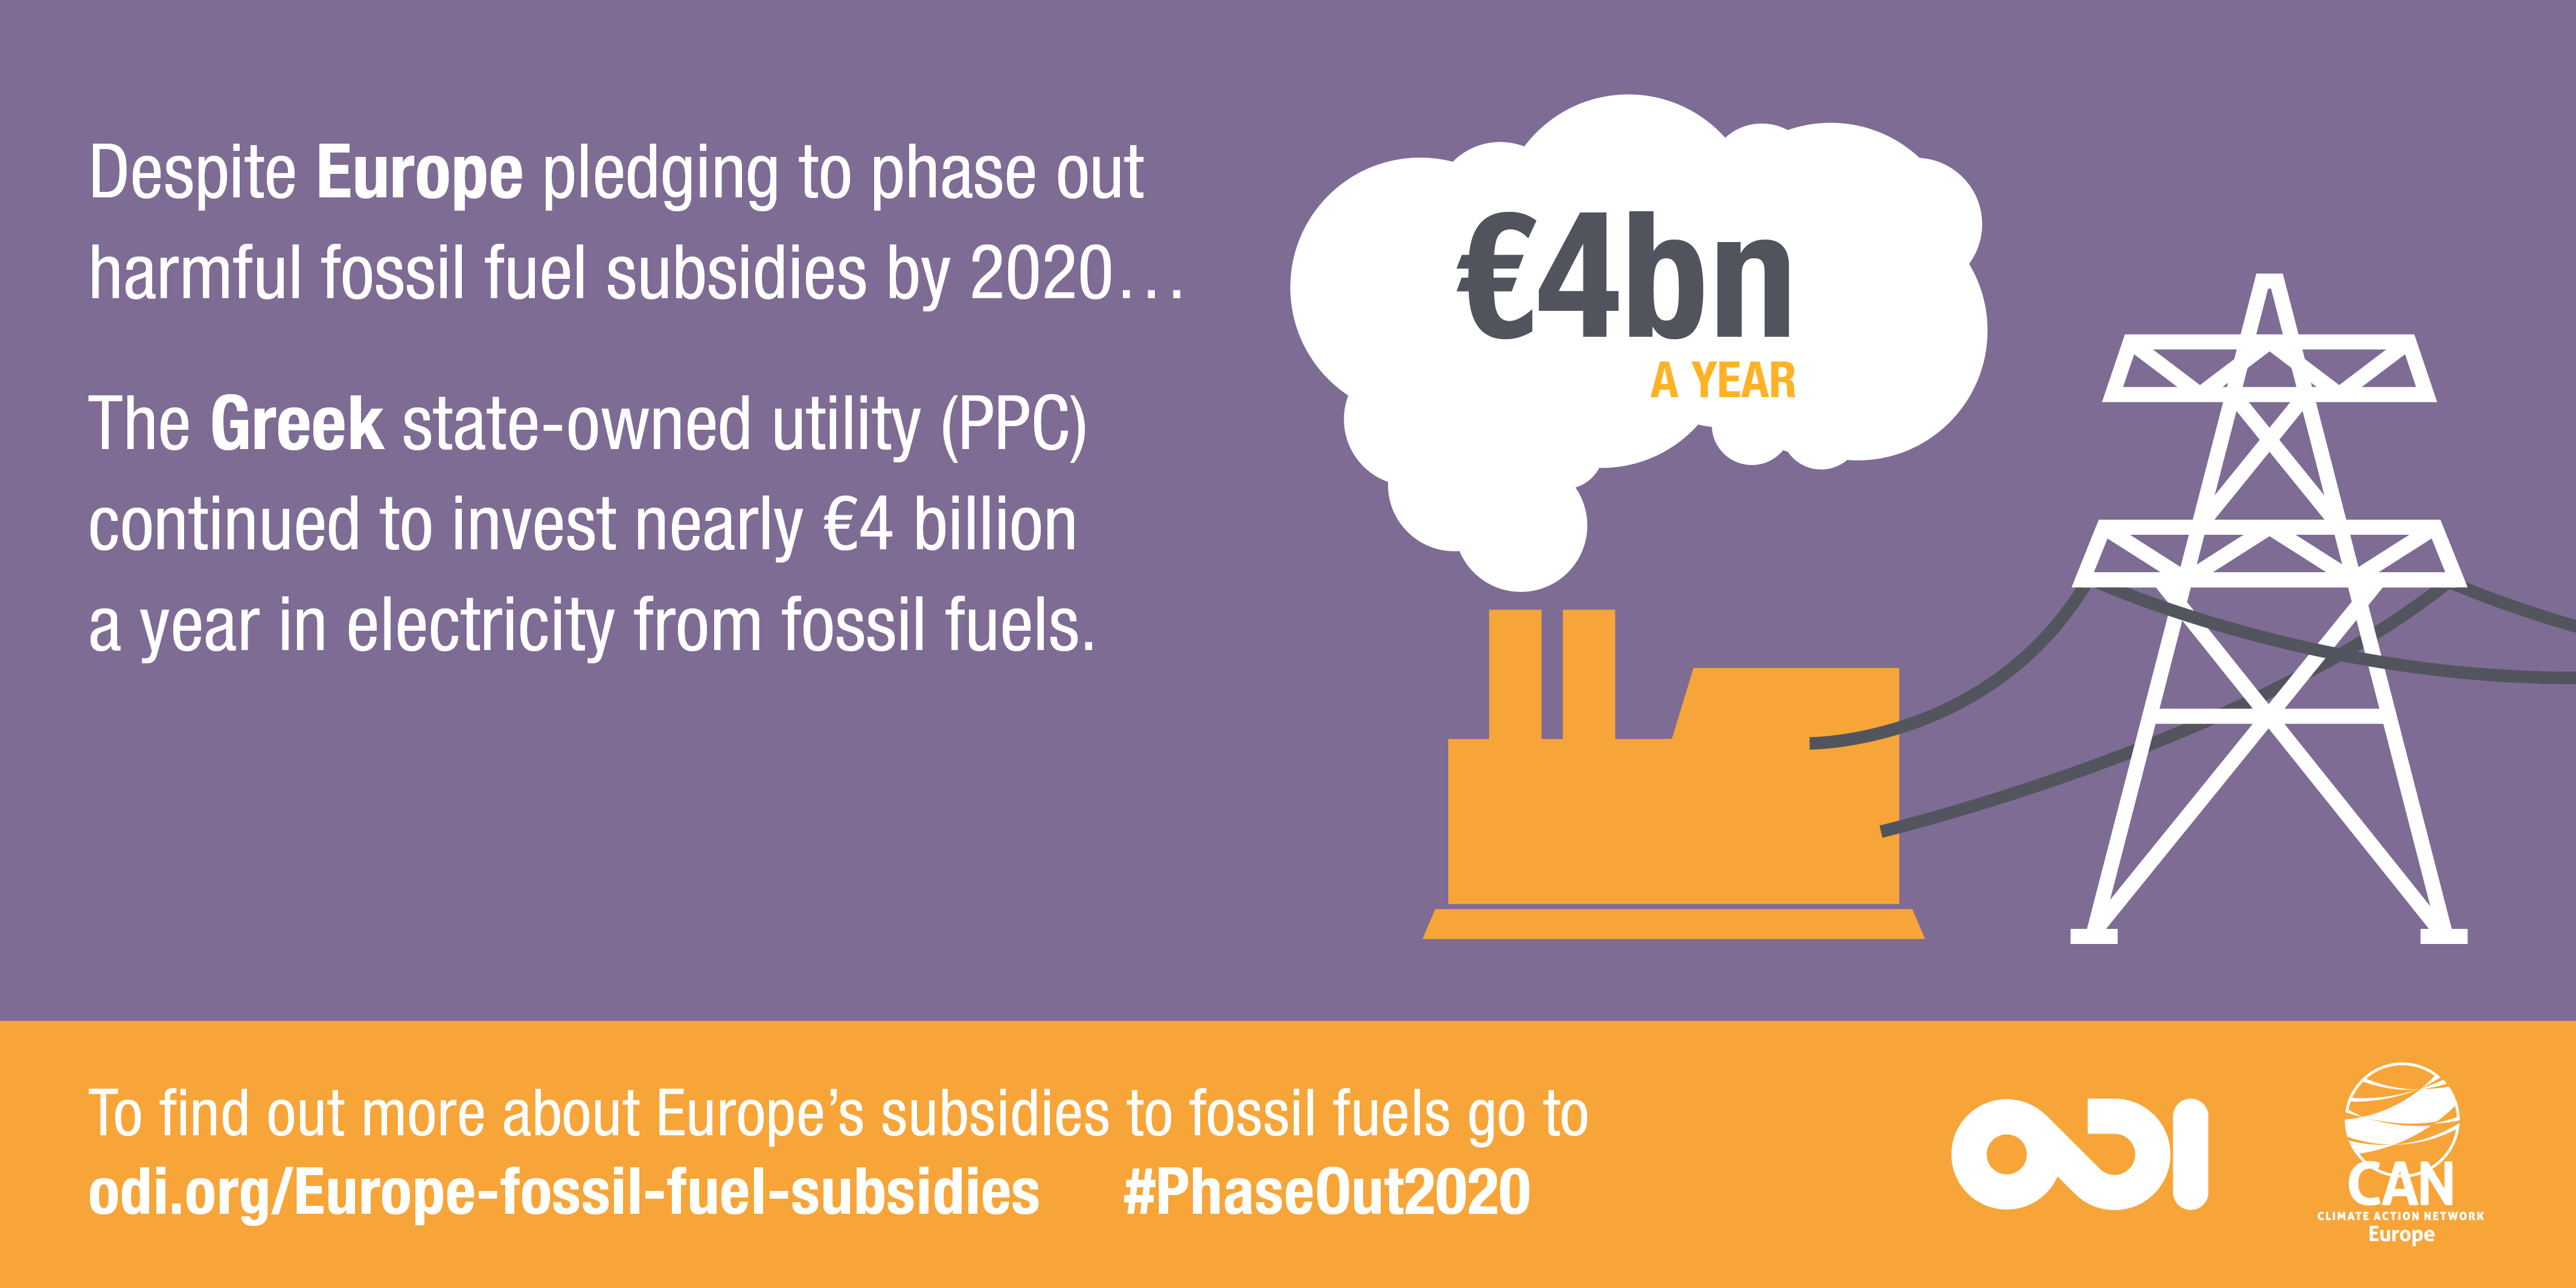
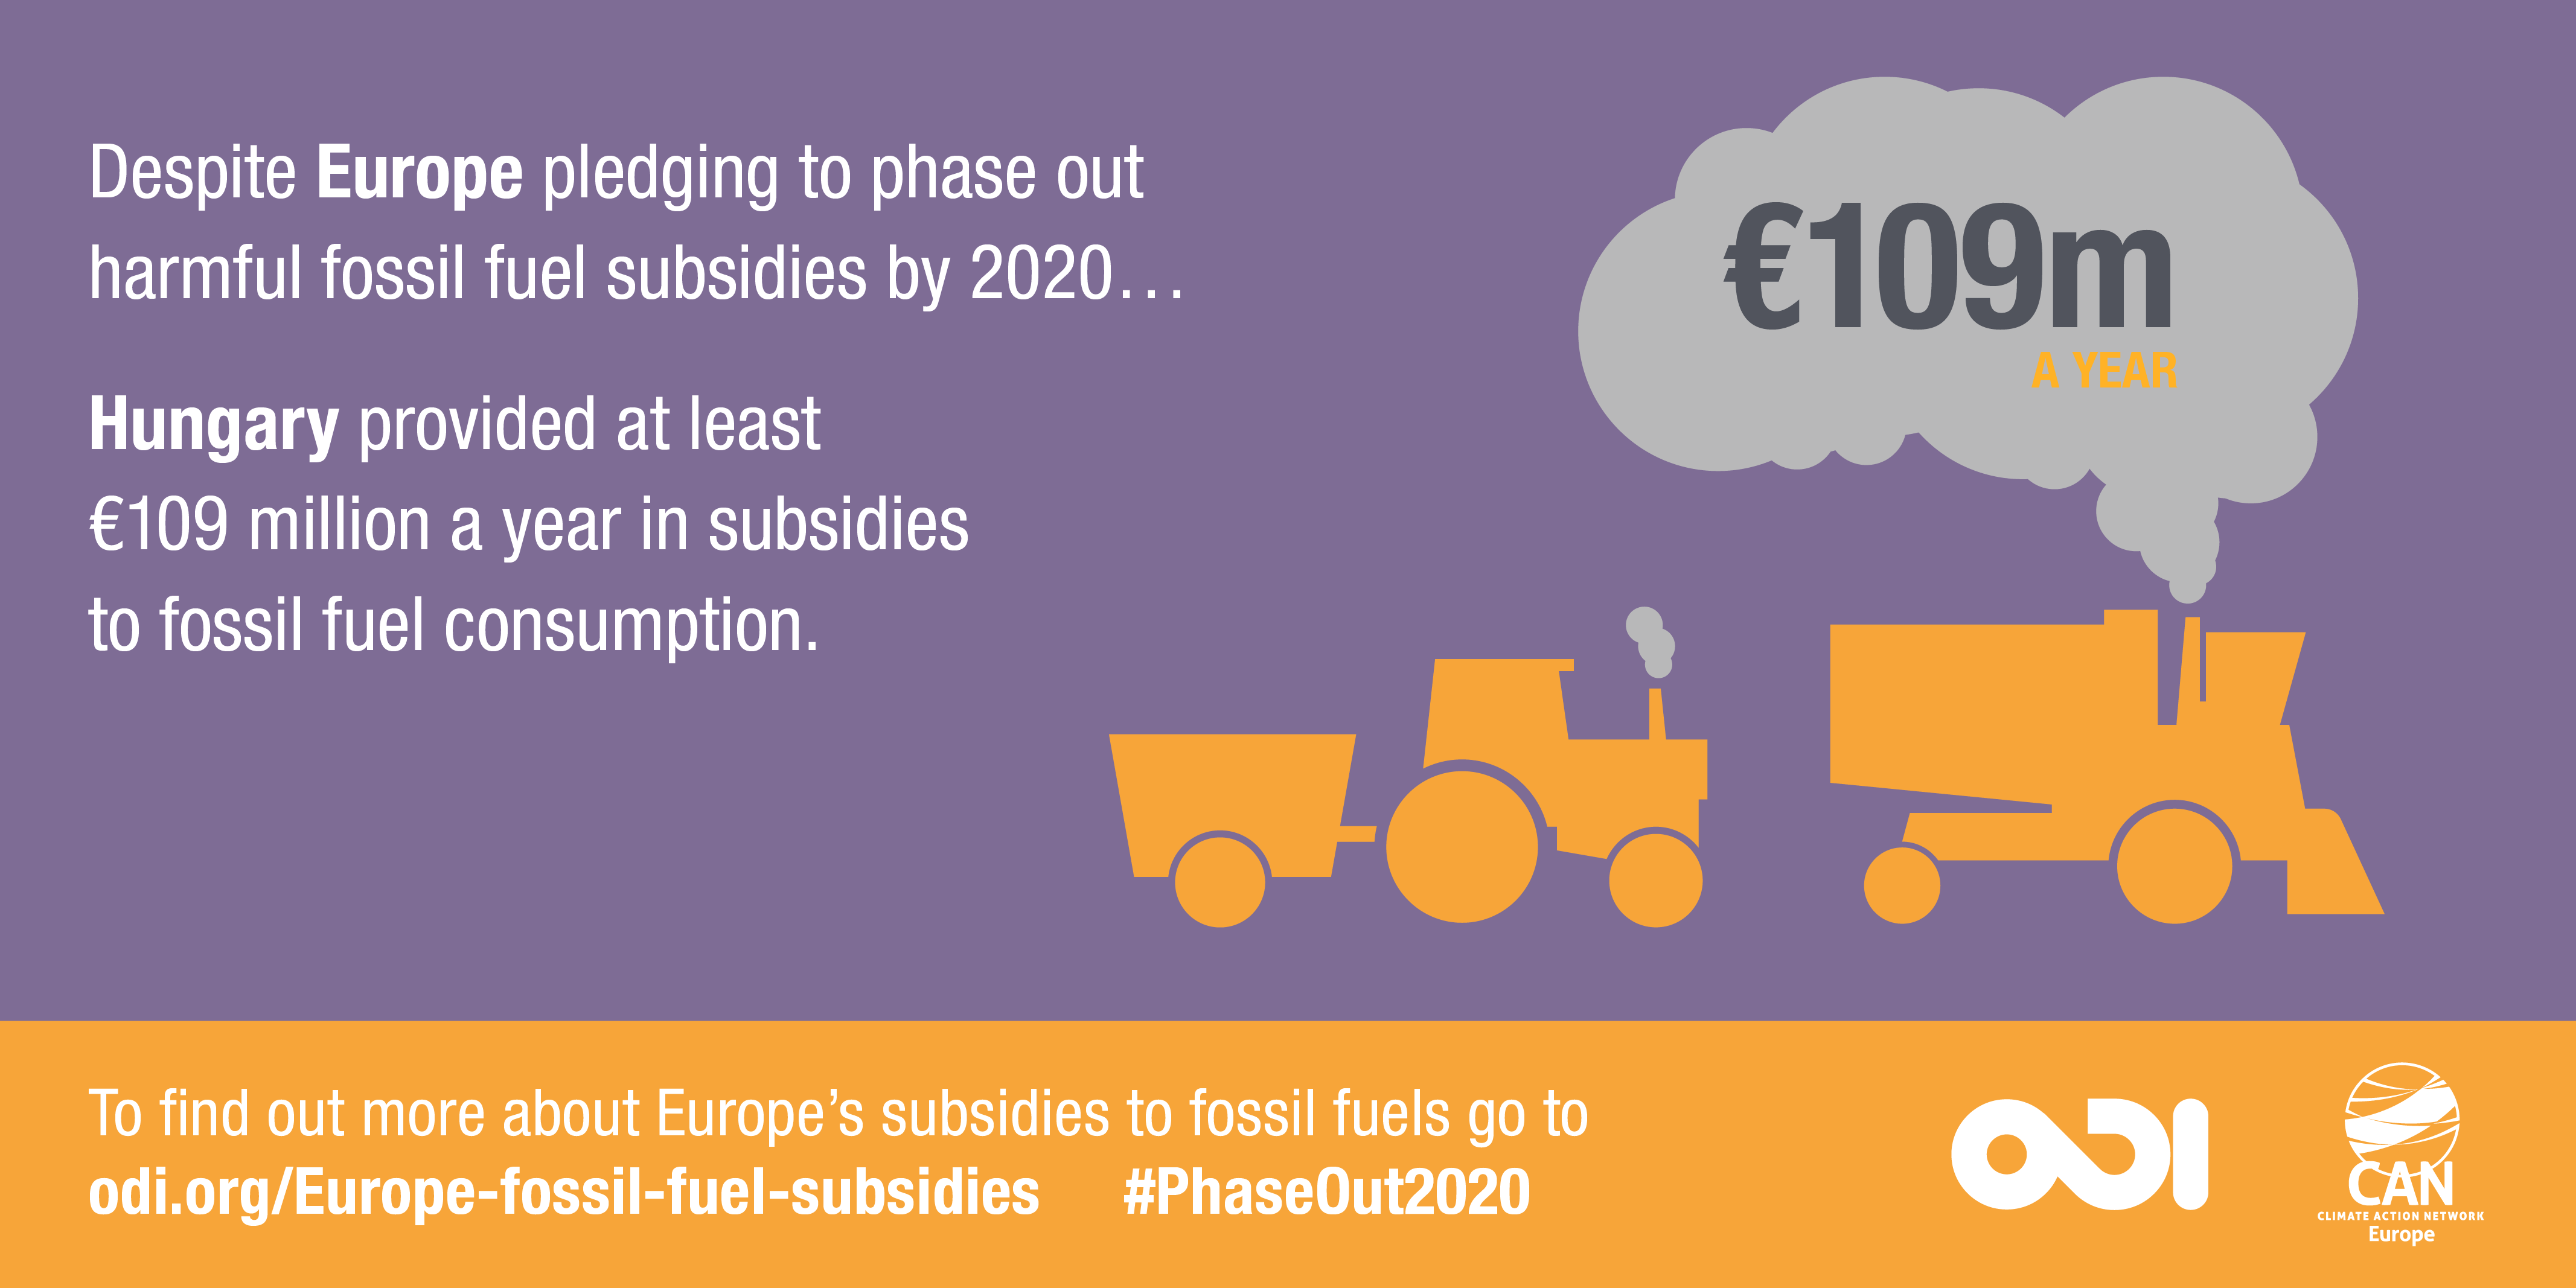
These infographics were made for the Phase-Out 2020: Monitoring Europe’s fossil fuel subsidies report
 |
 |
|
|
|
 |
 |
 |
 |
|
|
|
 |
 |
 |
 |
 |
 |
 |
 |
 |
 |
 |
|
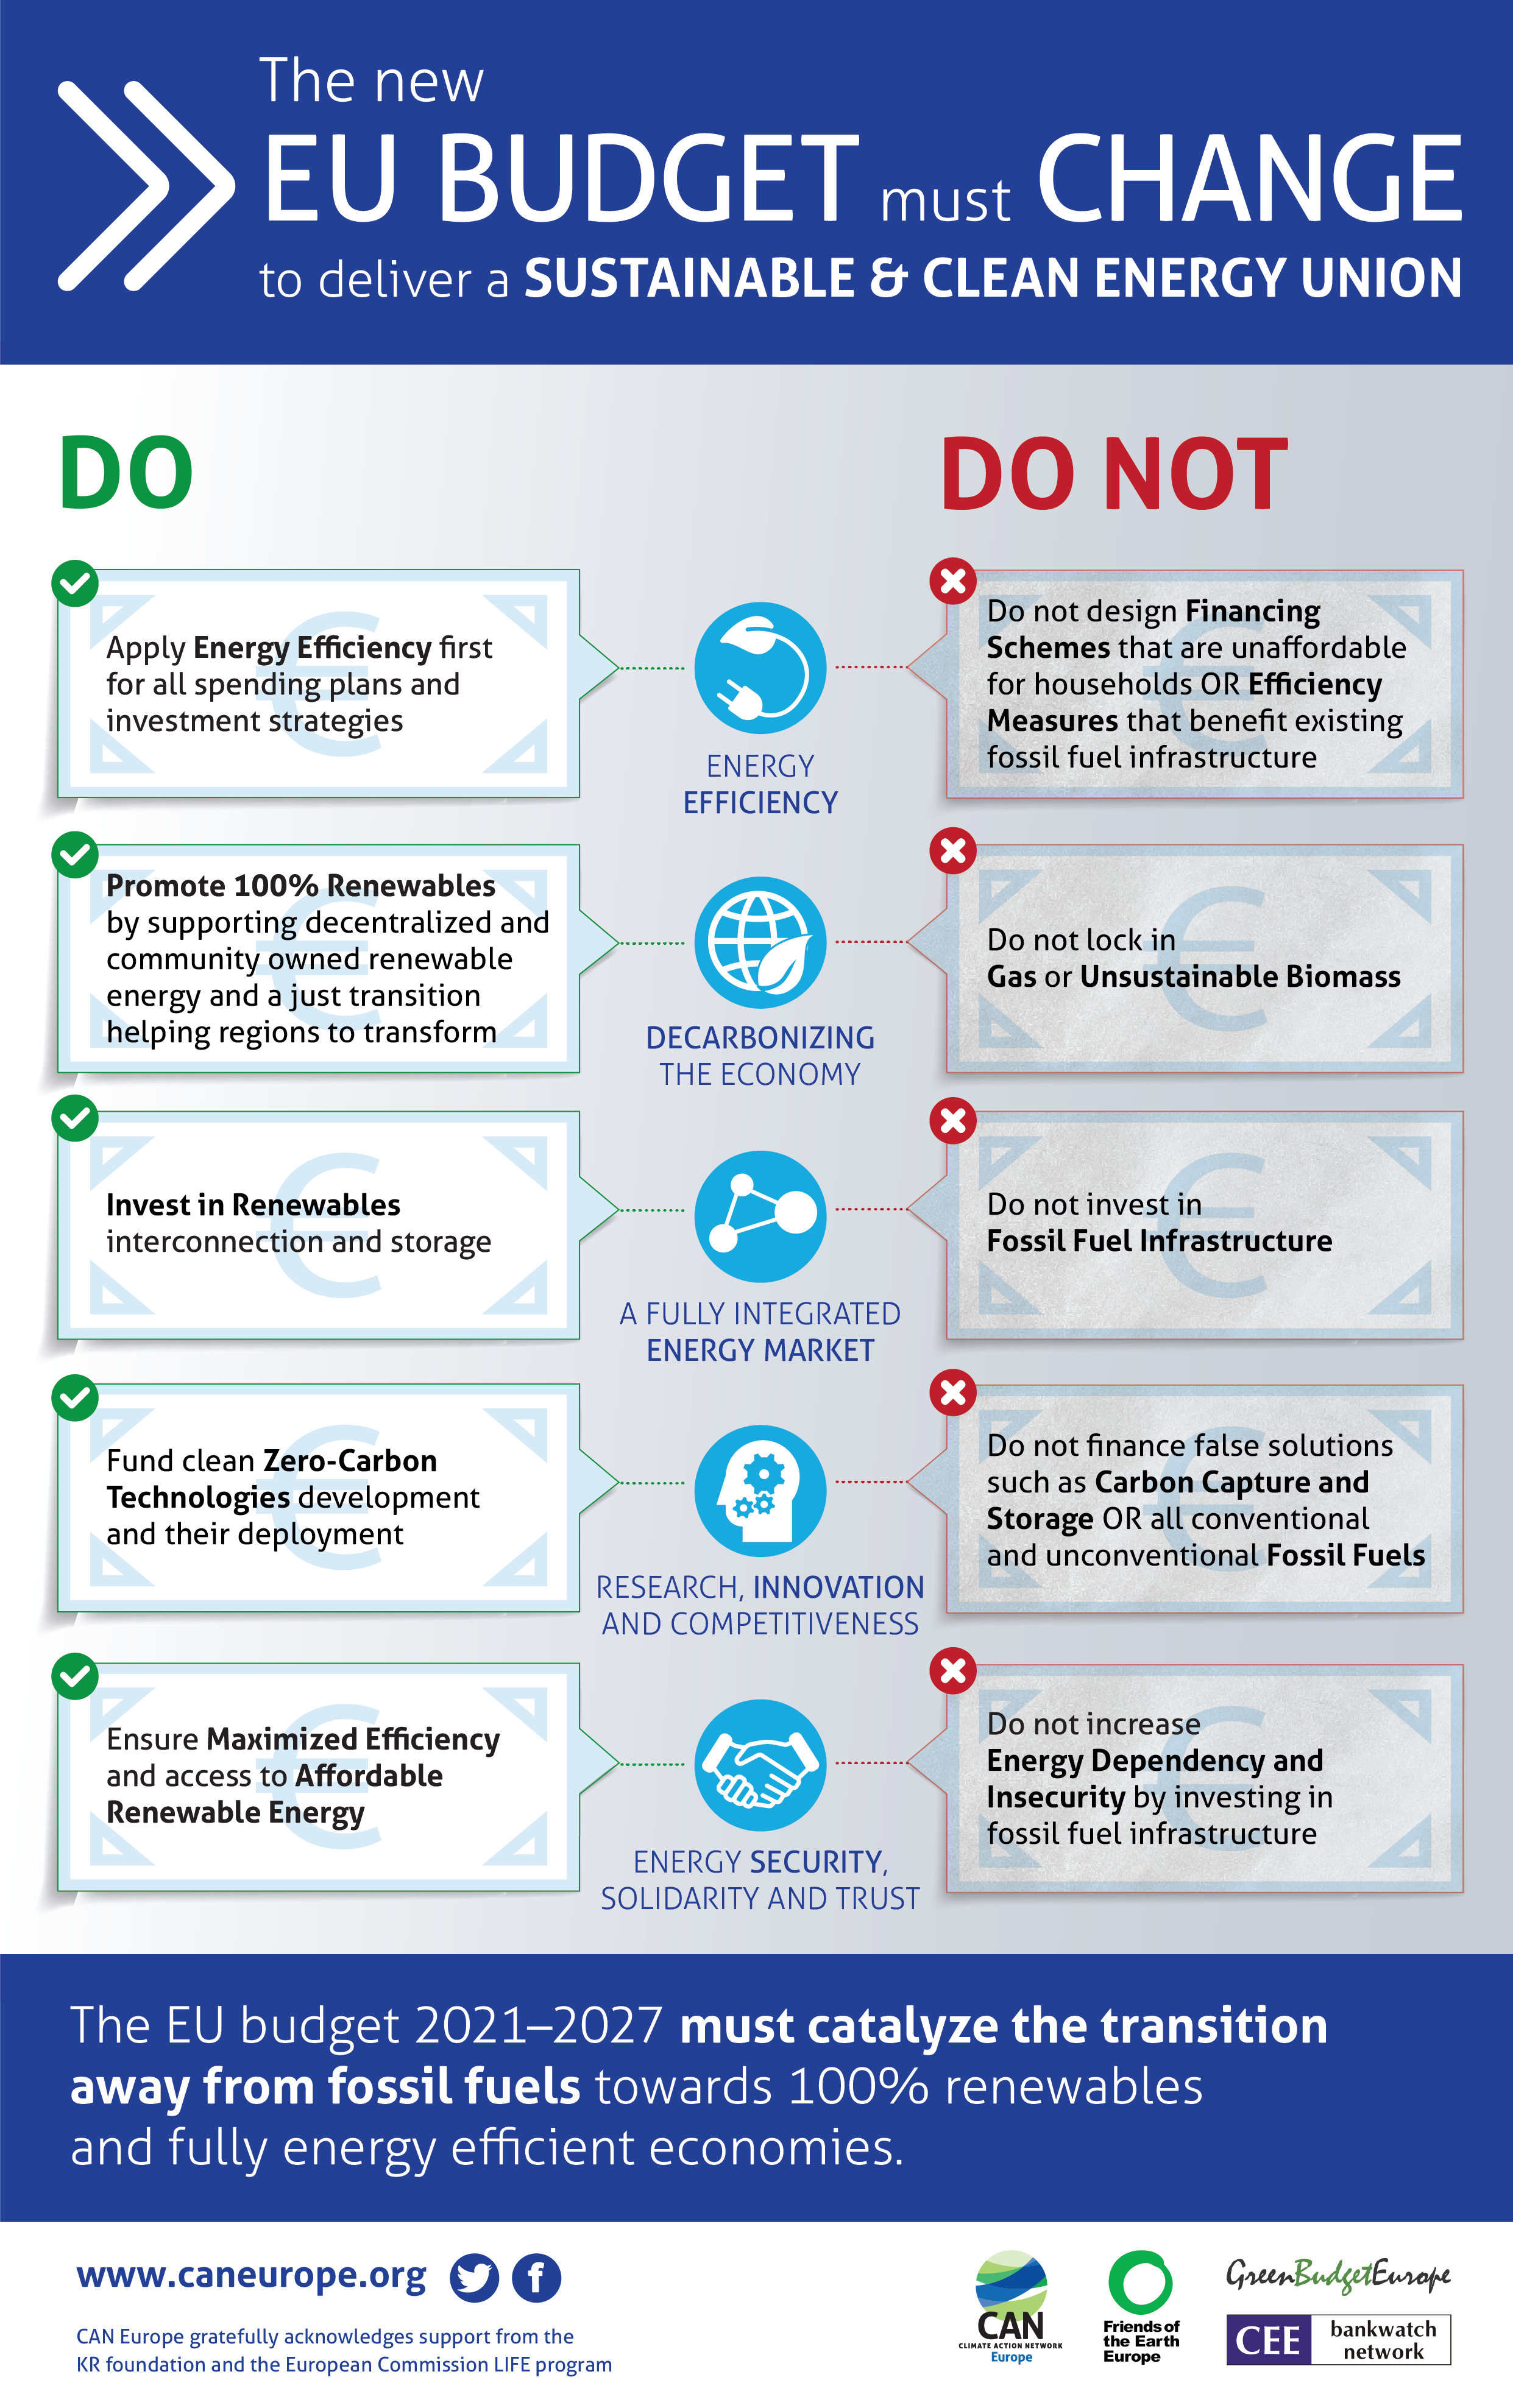
This visualization shows what the new EU budget 2021-2027 must do and not do to deliver a sustainable and clean Energy Union.
Download An EU budget for a sustainable and clean Energy Union
This infographic shows the huge discrepancy between what companies have to pay for their climate pollution and how much it costs citizens.
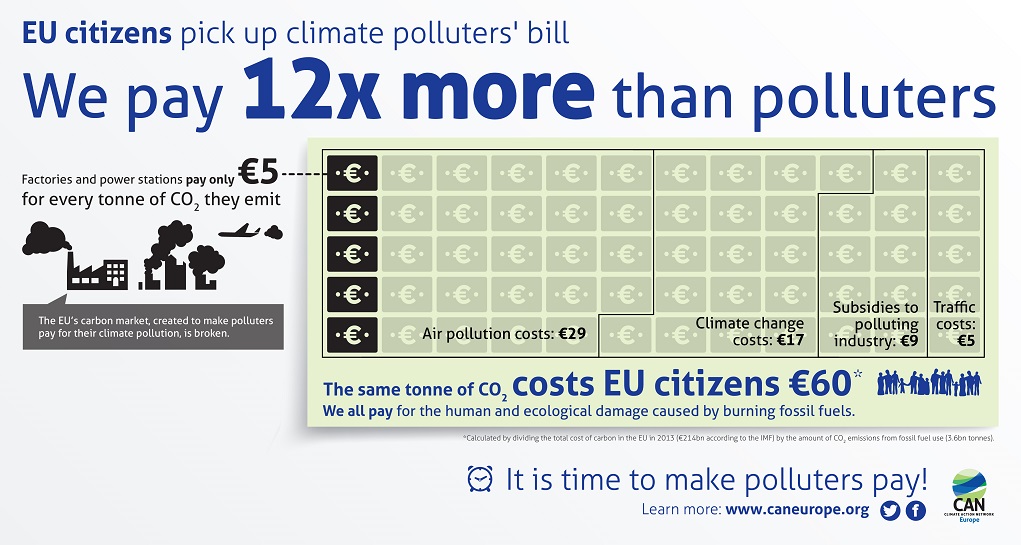
References:
– According to Carbon Pulse, in 2016 the average price of carbon under the EU ETS is €5.33.
– CO2-emissions in the EU: http://www.eea.europa.eu/data-and-maps/data/data-viewers/greenhouse-gases-viewer
– External costs of fossil fuels: http://www.imf.org/external/pubs/ft/survey/so/2015/NEW070215A.htm
Download Infographic EU citizens pick up climate polluters bill
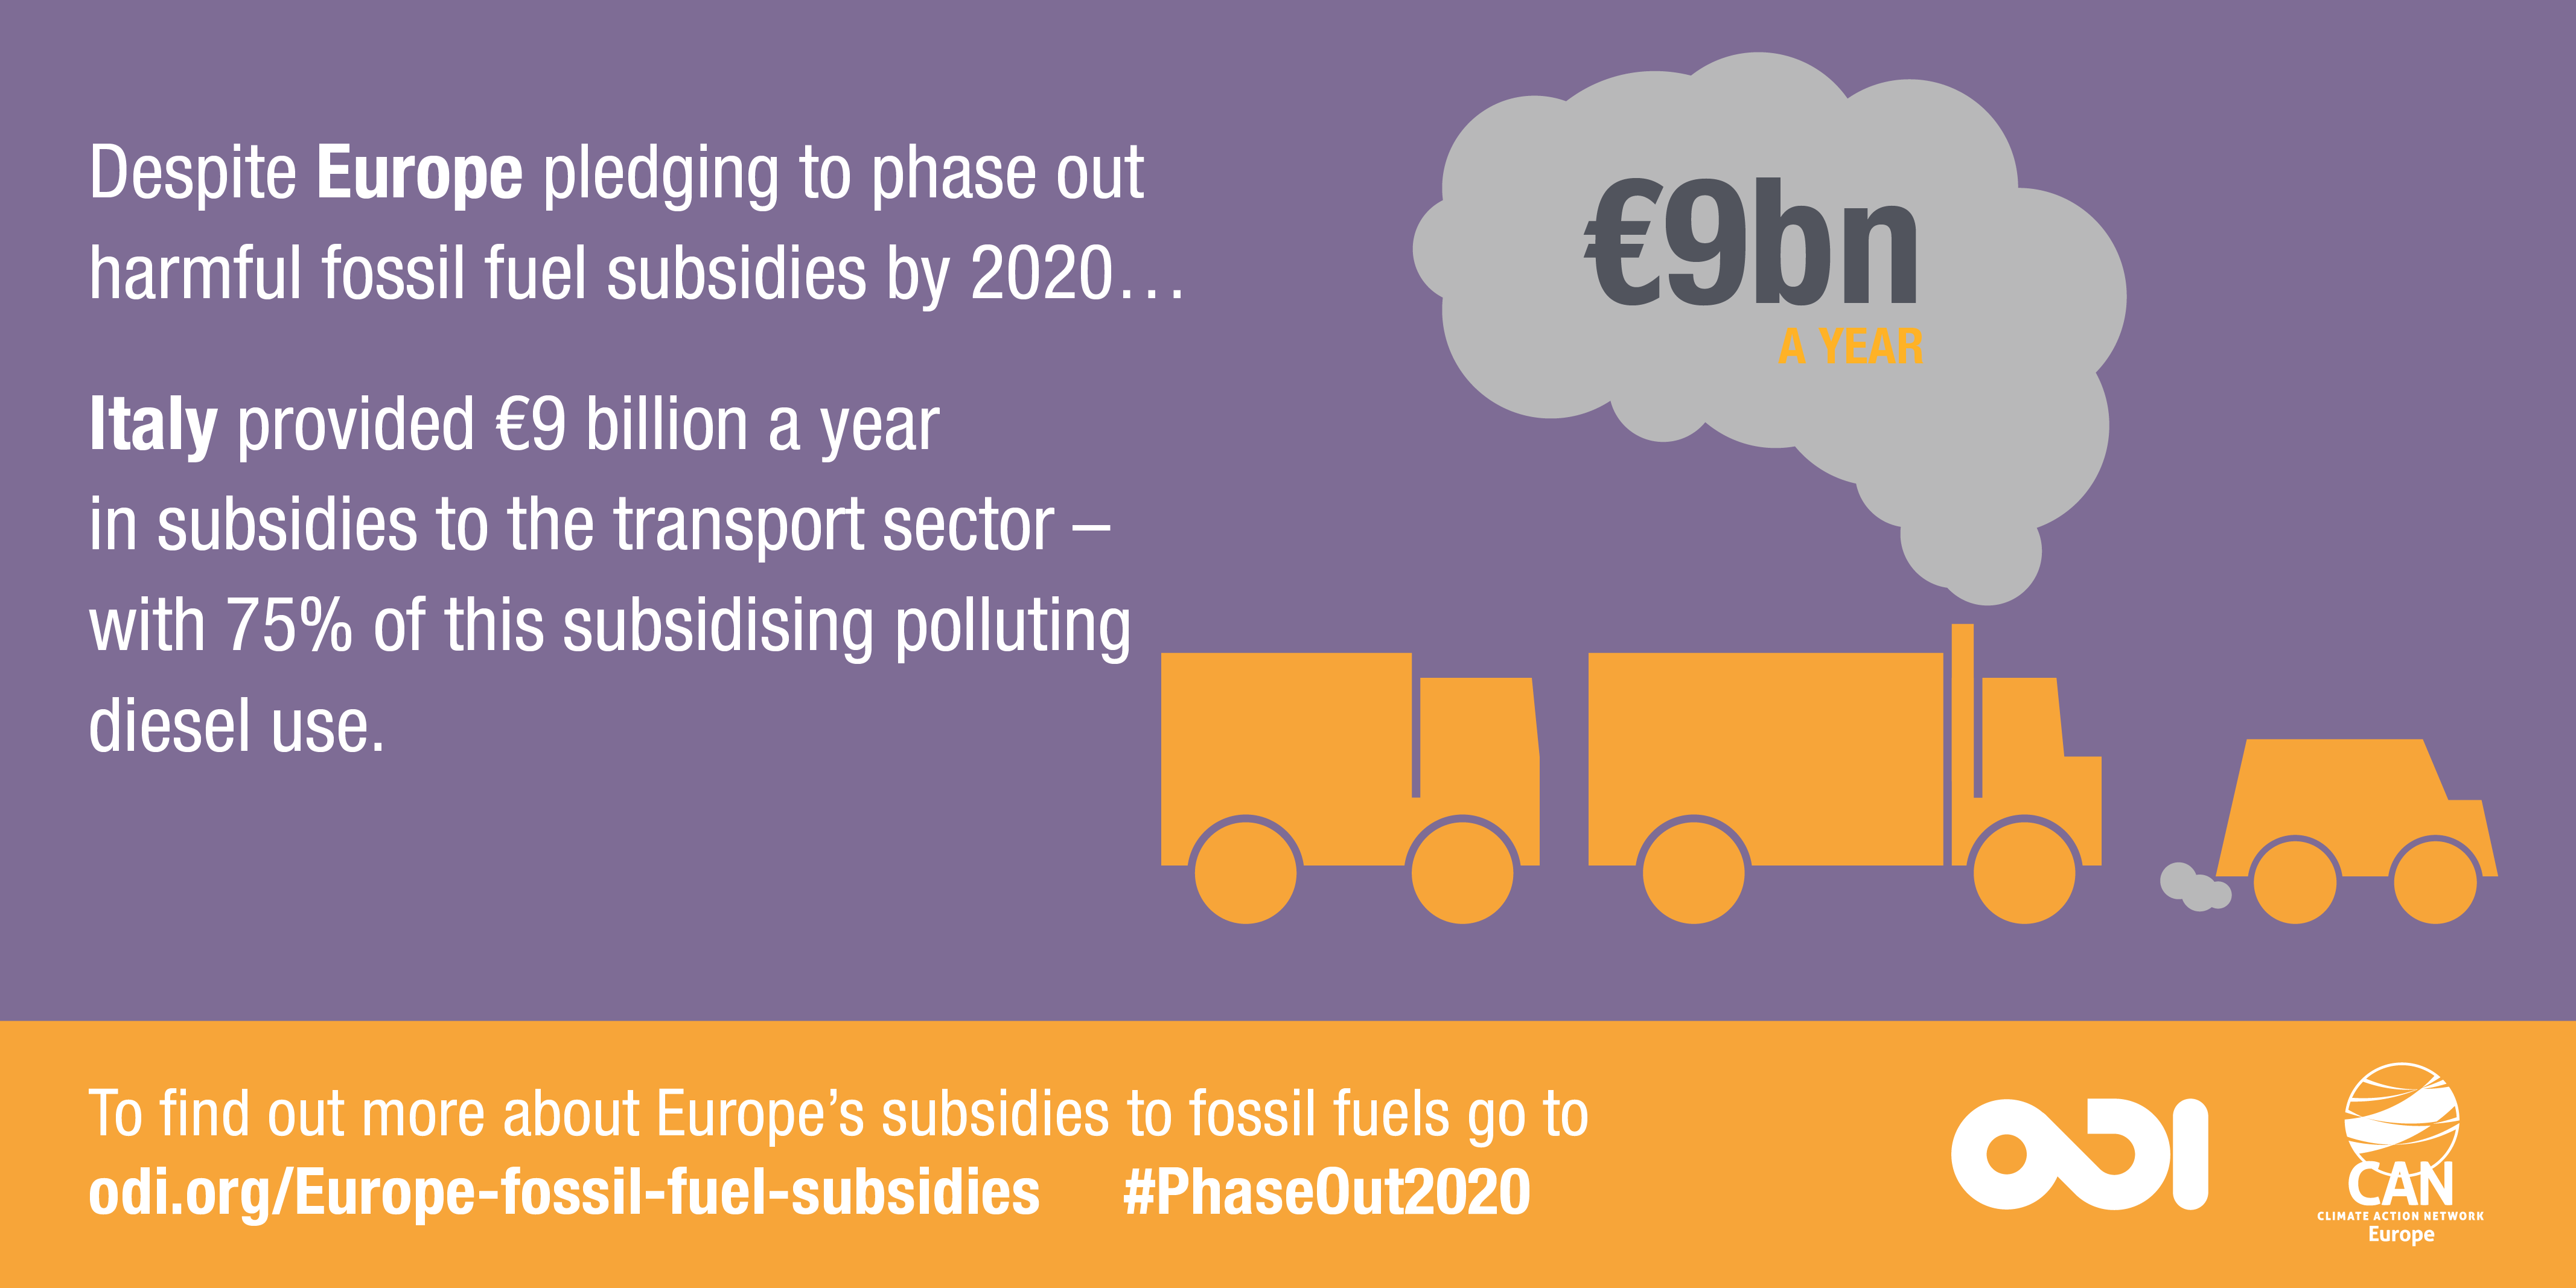
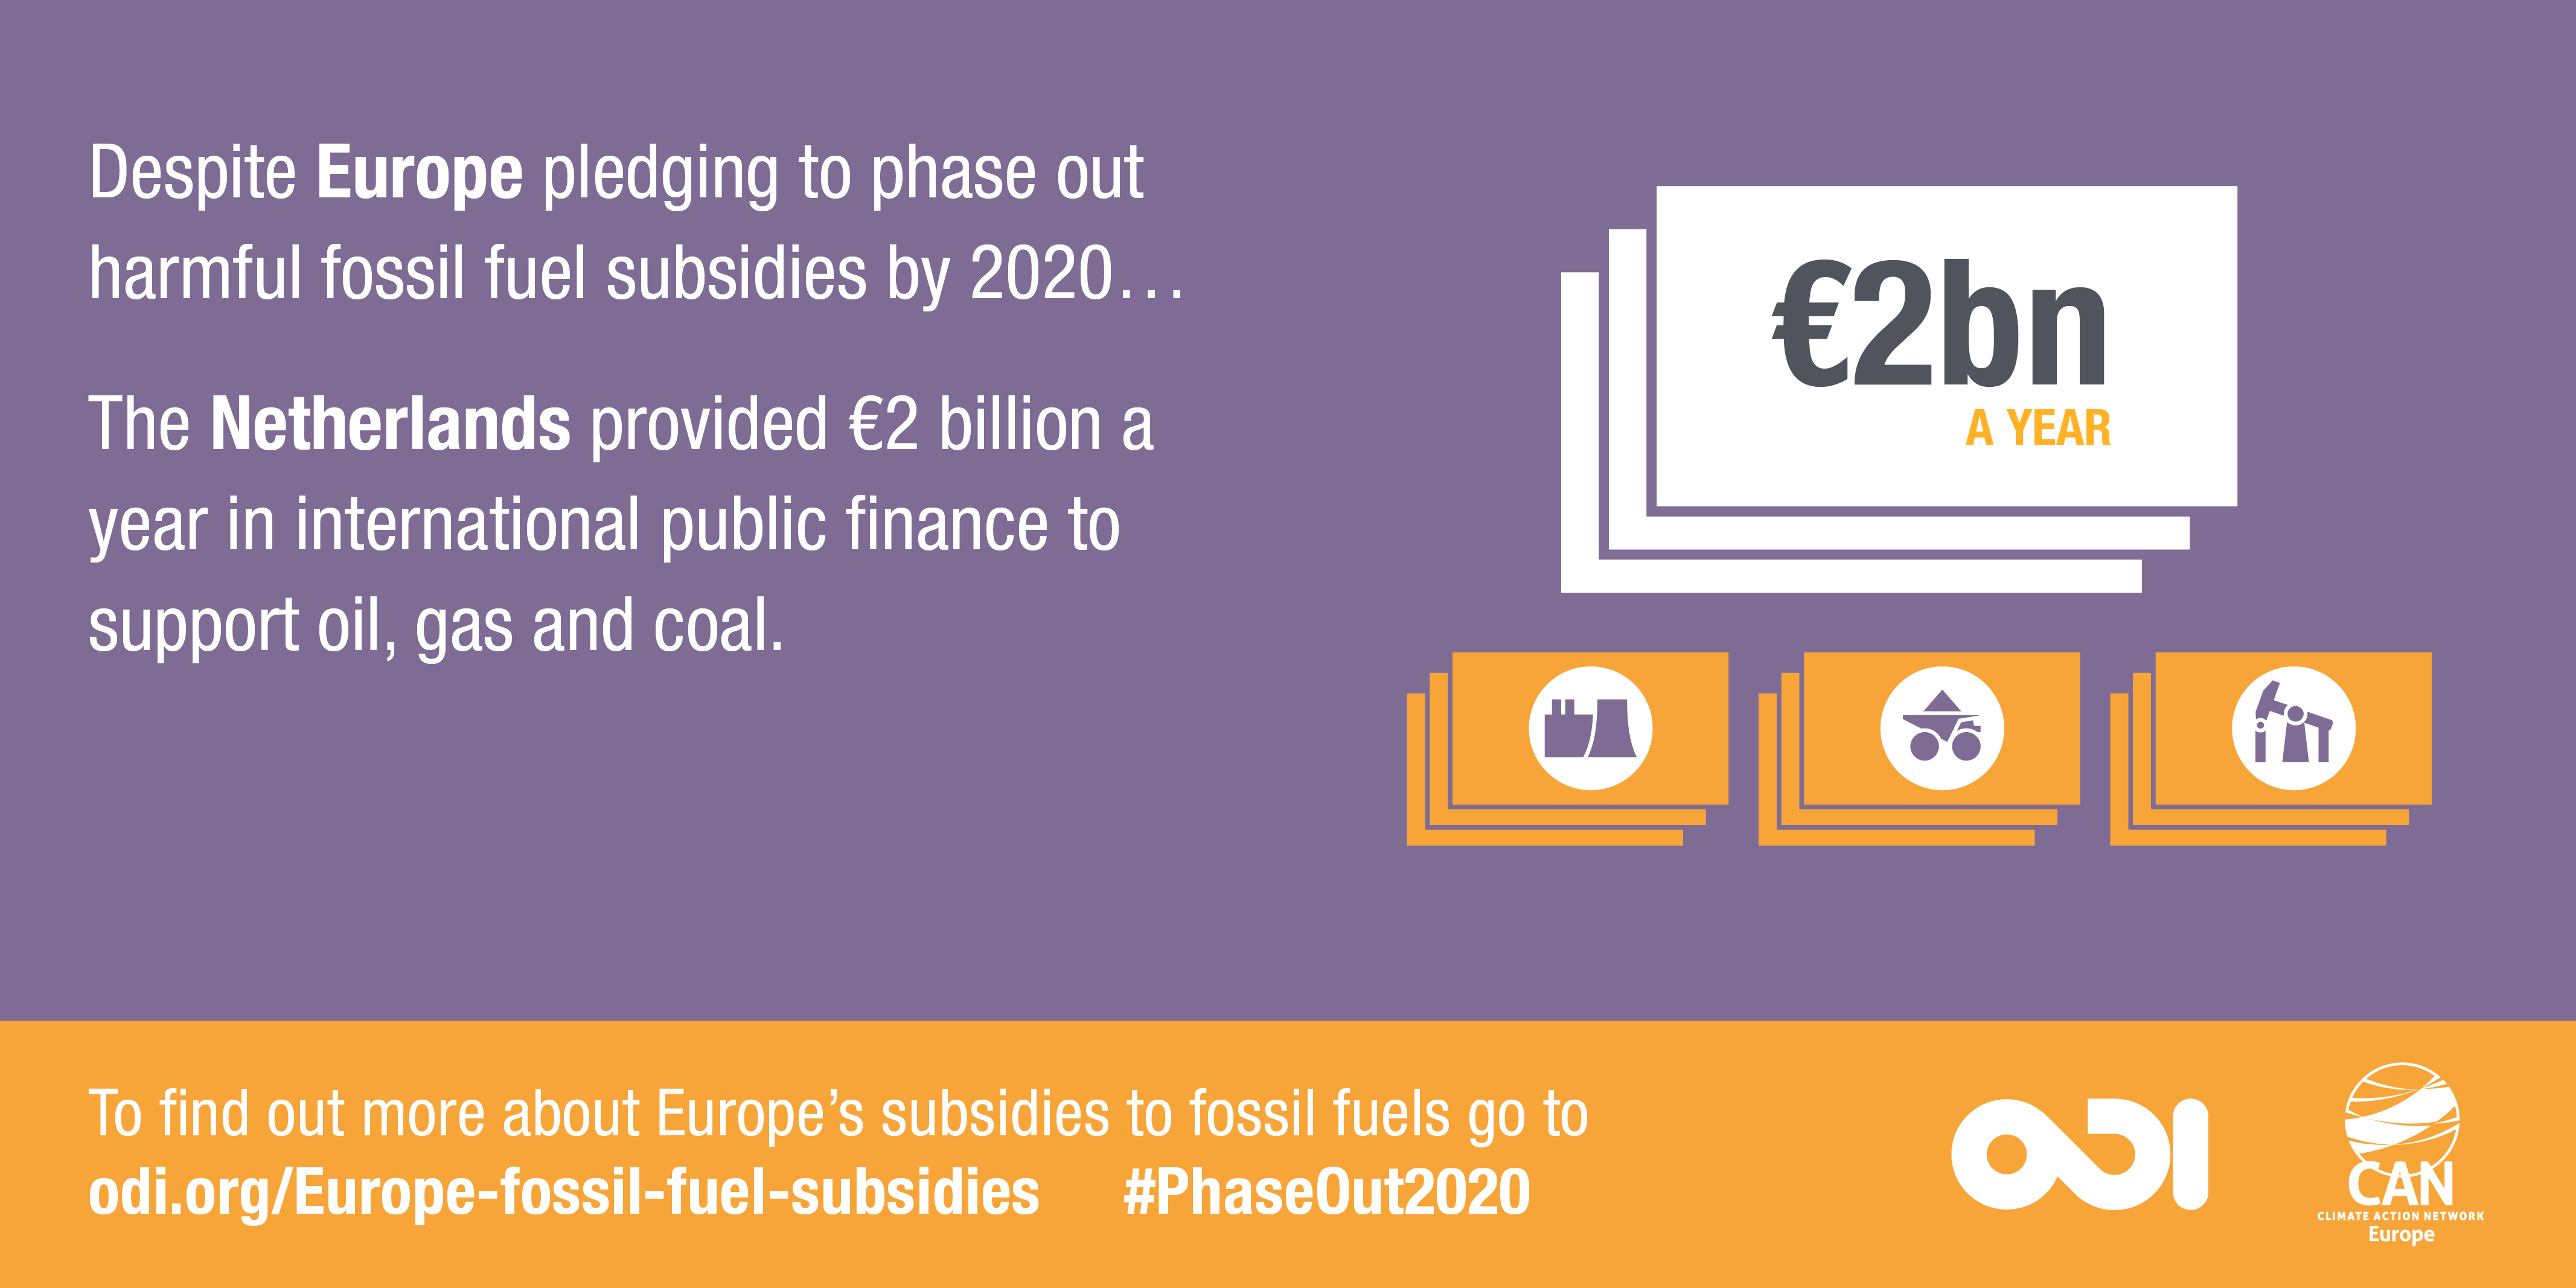
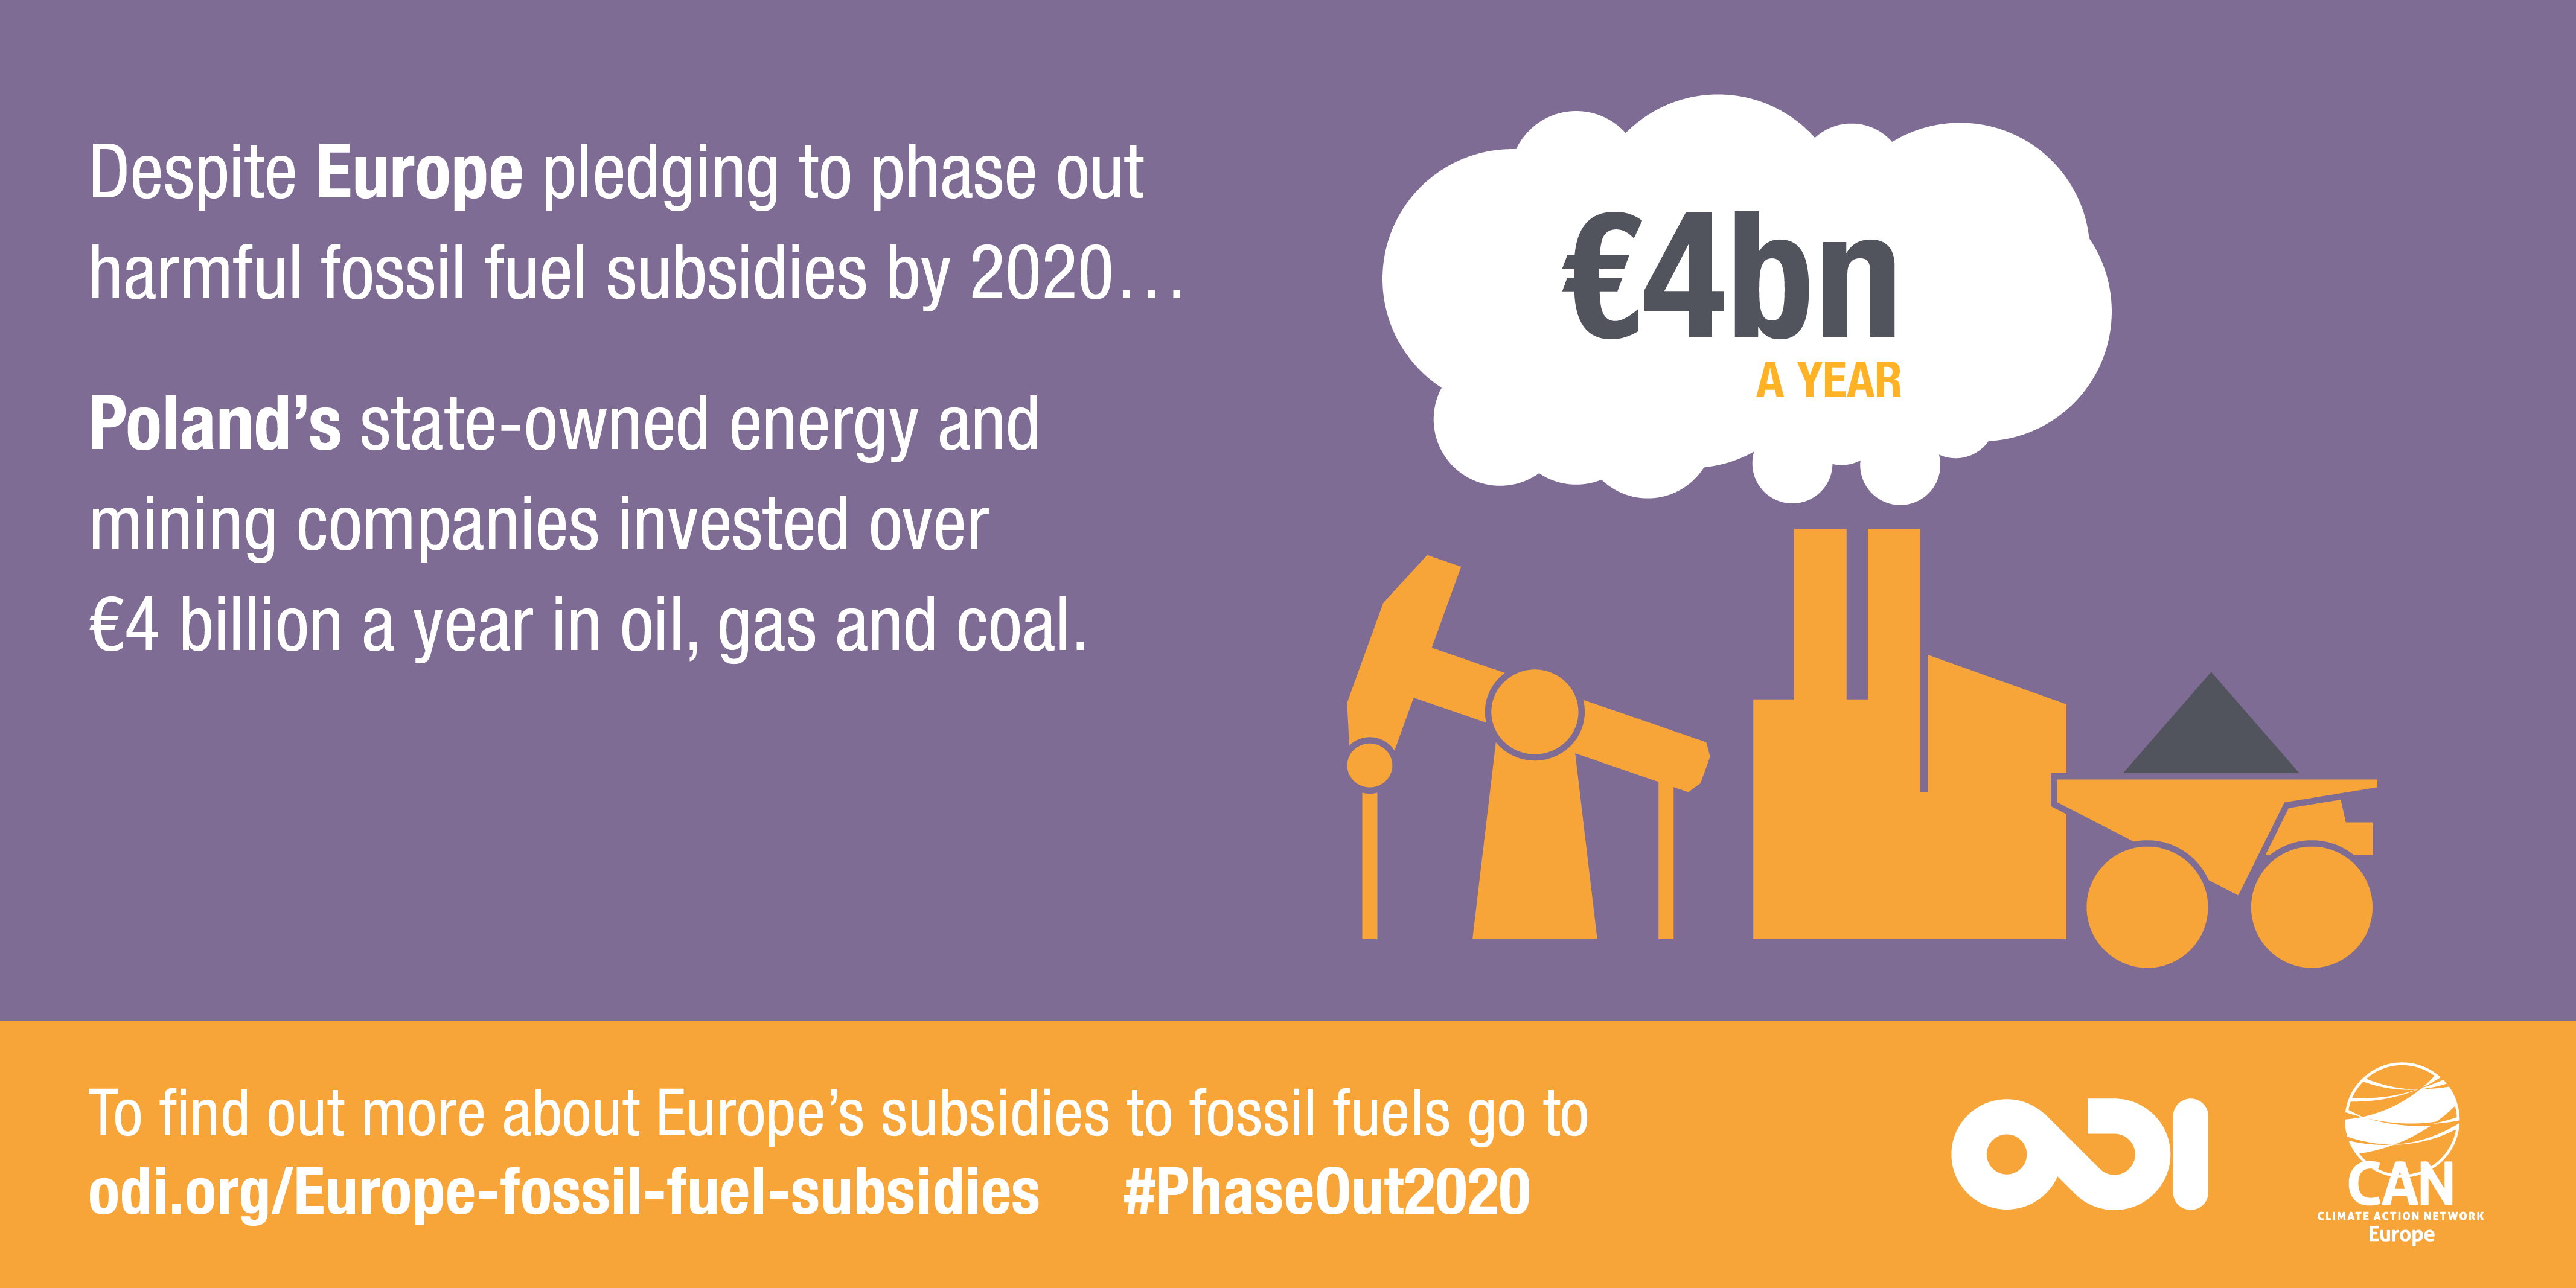
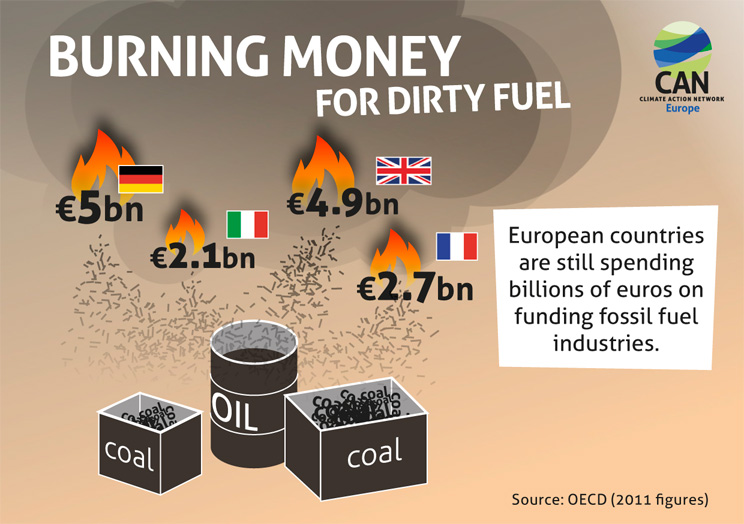
This infographic shows how much the four largest EU member states spend on funding dirty
fossil fuel industries.
Download Infographic Burning money for dirty fuel
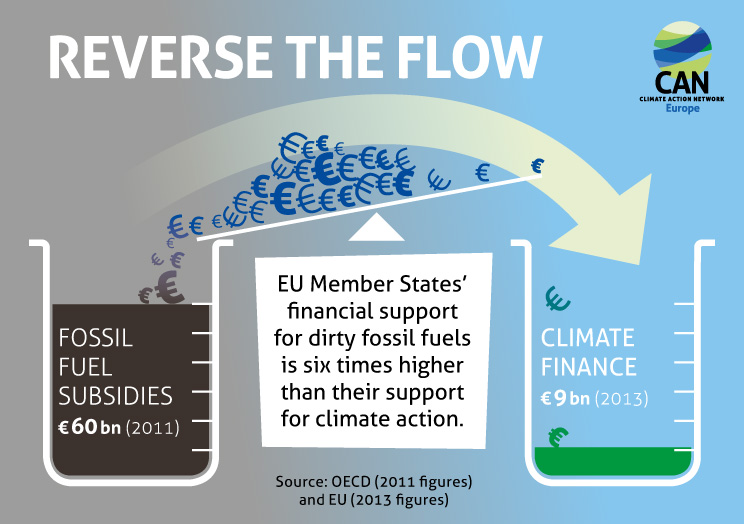
This infographic shows how much EU member states spend on fossil fuel subsidies versus how
much they spend on climate finance.
Download Infographic Reverse the flow
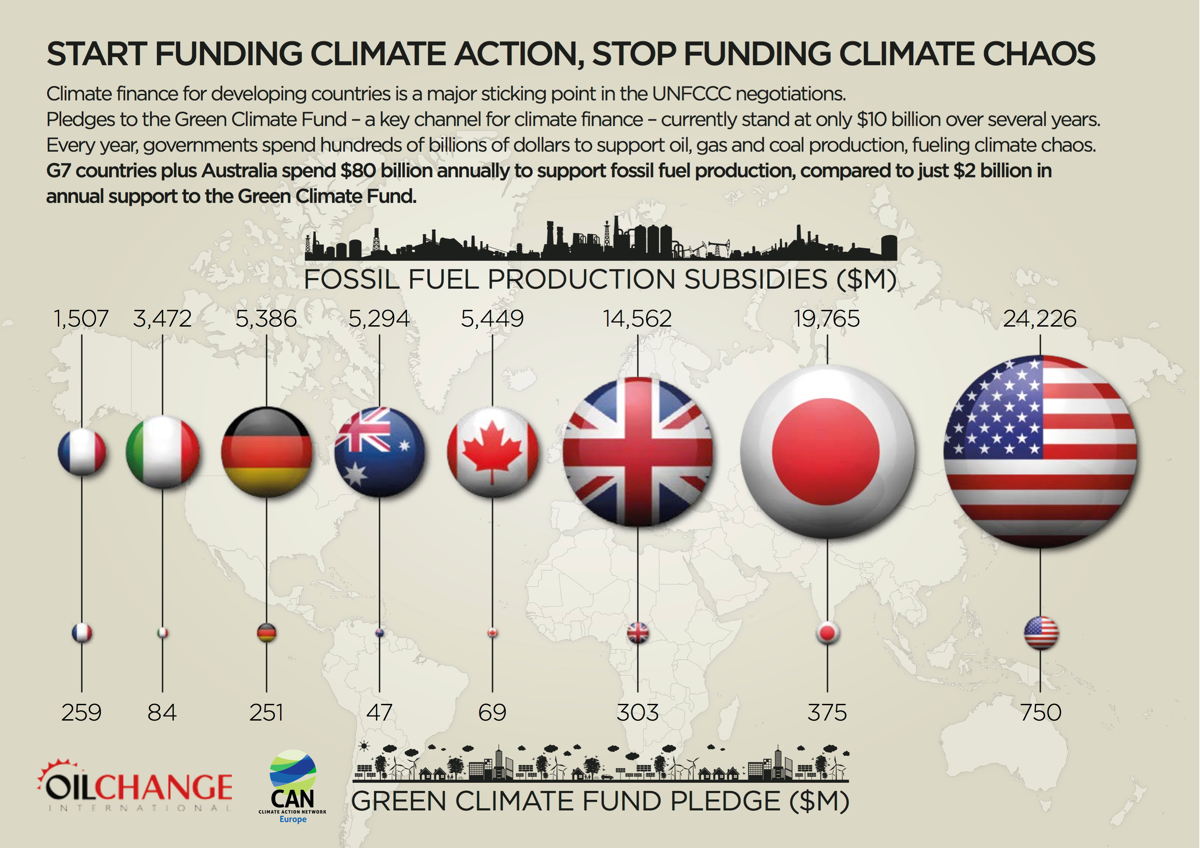
This infographic shows how much the G7 countries (of which 4 are EU member states) spend
annually to support fossil fuel production versus how much they contribute to the Green
Climate Fund.
Download Infographic Start Funding Climate Action, Stop Funding Climate Chaos
This infographic shows how much the G20 governments spend on national production of fossil
fuels versus how much developing countries receive in adapting to climate change.

Download Fueling climate injustice infographic
This video shows how money has equal potential to do good and to do harm. While governments
have promised to scale up climate funding, they keep spending more money on fossil fuel
pollution. Tell your government that your tax money should do good, not harm. Published in 2013.
Every coin has two faces from CAN EUROPE on Vimeo.
